- Search Forex Factory
- 21 Results
-
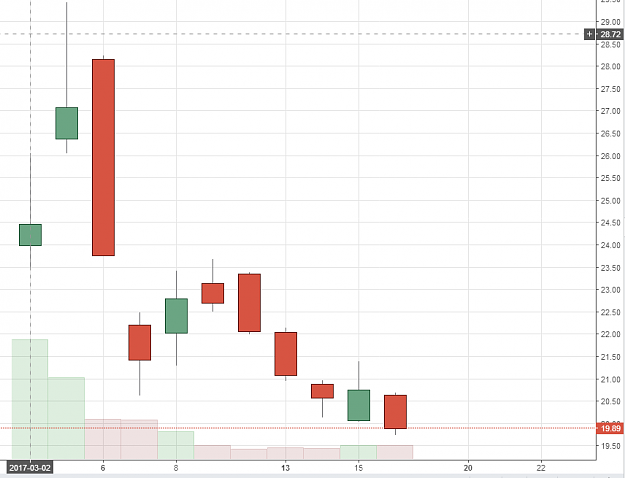
 ashenv replied Mar 16, 2017
Not sure if anyone remains interested in this iteration, but I got an alert today re: SNAP falling under $20. Looks like the market has spoken on where they see its value (see Twitter). I didn't trade it, but if you were long from under $22 from ...
The Really Useless Thread
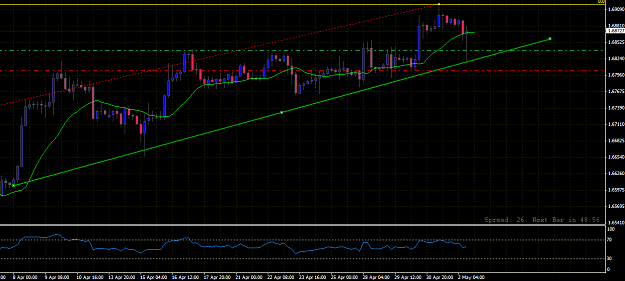
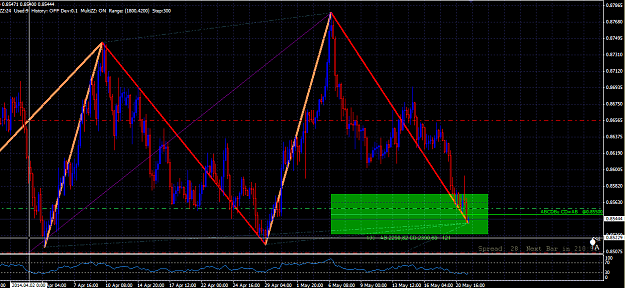
- ashenv replied Mar 15, 2017
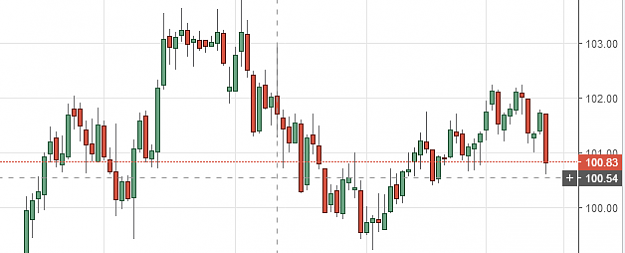
Guess I was expecting a stronger move one way or another. DXY holding 100.65 support for the moment. image Not exactly seeing a parade of dollar bulls coming in, though...
The Really Useless Thread
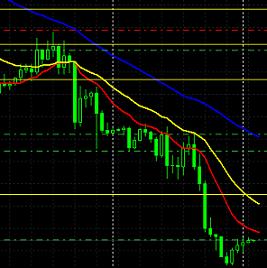
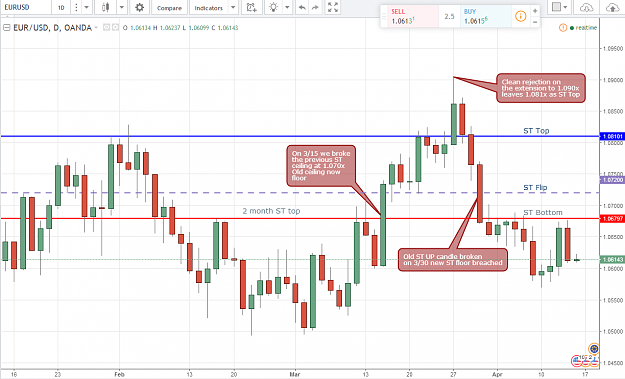
- ashenv replied Apr 8, 2015
Yes. image Will admit to being a bit gun shy after the last FOMC minutes (and watching a lot of patient shorting unravel...). Took an almost no lev. long from 1.077 just to see, but am feeling better about starting to short again. Welcome, Cryptic ...
EURUSD
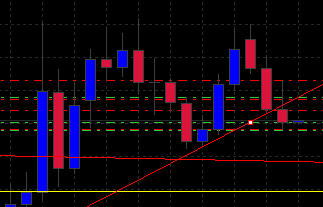
- ashenv replied Mar 31, 2015
Target #2 hit @ .72310. Decided to close the whole trade here. Not certain what to expect from here in the short term... image
EURGBP

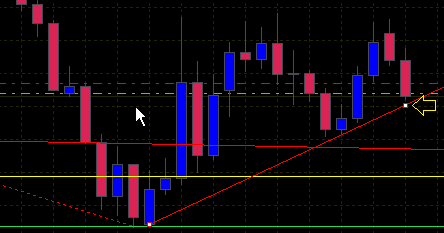
- ashenv replied Mar 27, 2015
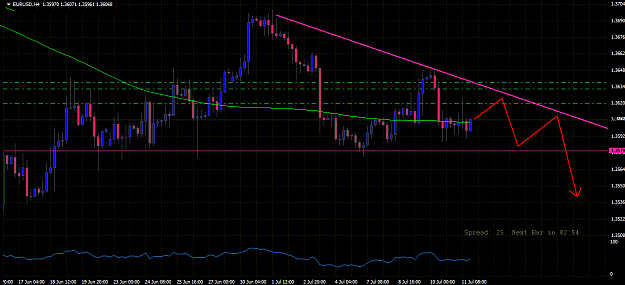
E/G broke up out of the descending channel a few days back, but the break looks weak and is already waning. I took a small short position after the bounce from trend line resistance turned support @ .72975, st: .73150 (idea invalidated by retest of ...
EURGBP


- ashenv replied Mar 26, 2015
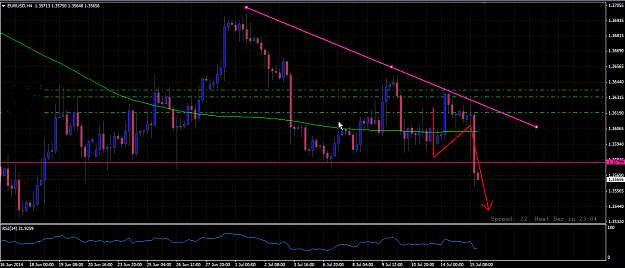
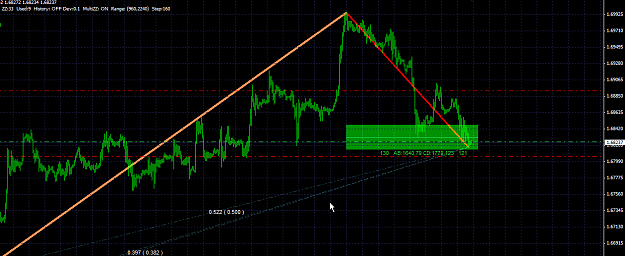
I went ahead and closed that short after a couple days. I think here around 1.7550 it may stall. image
NZD/USD

- ashenv replied Mar 25, 2015
Well, it brushed it and tripped that buy stop in the end. Guess we'll see if she has legs. image
GBPNZD trading calls
- ashenv replied Mar 25, 2015
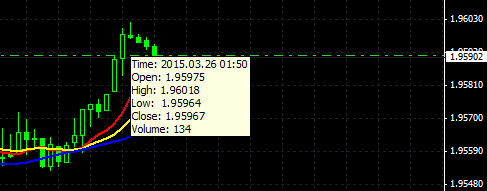
Doesn't look like anything is getting past 1.9580 today... went ahead and closed for +160. May set a pending buy at 1.96 if it decides to break up, but doubting it atm. image
GBPNZD trading calls

- ashenv replied Mar 24, 2015
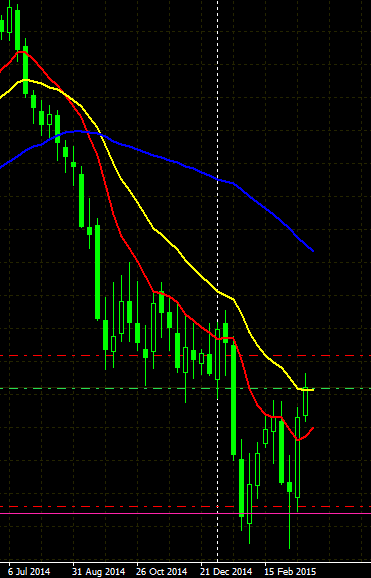
Like that daily candle. Shorting this pullback that peeked past the the 21 EMA (wkly) @ .7655, tight st @ .7715, targets .7550/.7410/.7290. If this trade survives the data, that is. image
NZD/USD


- ashenv replied May 21, 2014
Also appears to be an ABCD Bullish pattern on H4: image
Making Bank: The Harmonic rhythm of the market
- ashenv replied May 13, 2014
GU-1hr One2One Bullish Setup image It seems most here are bearish on GU (esp. in light of bearish EU sentiment w/ correlation), but if the uptrend were to resume this pattern might be in play. It wouldn't surprise me considering how often it ...
Making Bank: The Harmonic rhythm of the market
- ashenv replied May 2, 2014
Yeah, as much as I would like to celebrate - it's still early. GU has respected this nice upward channel though. Right on through the NFP. image
Cable Update (GBPUSD)