- Search Forex Factory
- 40 Results
-
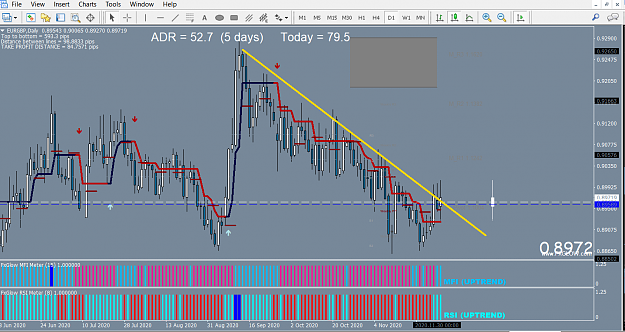
 apo replied Jul 26, 2023
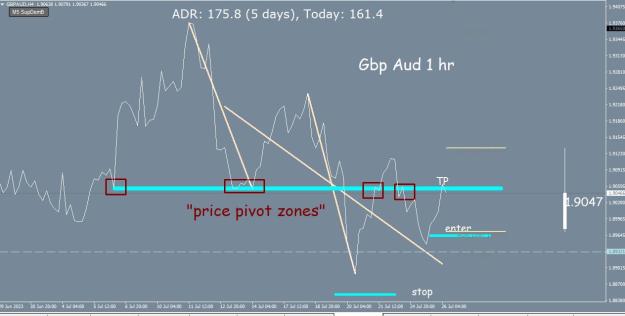
Yes...I'm using line charts ( which do not show the wicks ). The bar " closes " have always proven to be of greater value than the wicks. Although many will disagree with this. See in the chart the rectangle ( price pivot zones ) as named by James ...
Fractal Geometry
- apo replied May 20, 2023
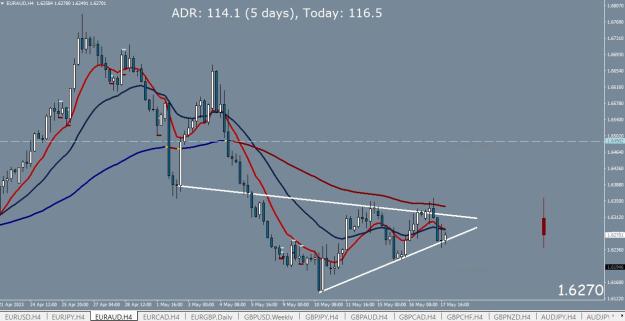
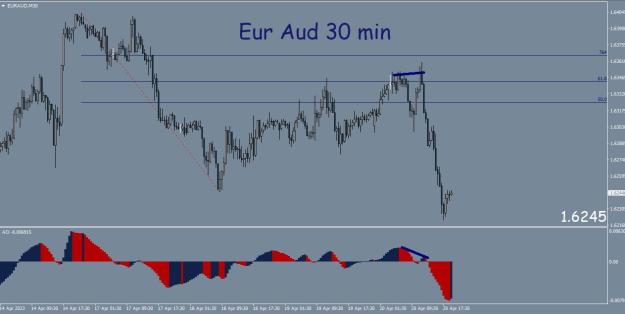
The Eur Aud which started as a wedge / flat top triangle morphed into sideways congestion. There were 4 crossovers within the congestion and that's a "red flag" if you're trend trading. But again...notice the area where price found support. It was ...
MA Crossover System that works for me
- apo replied May 20, 2023
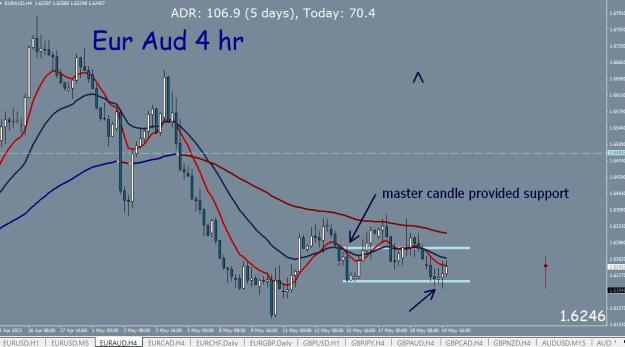
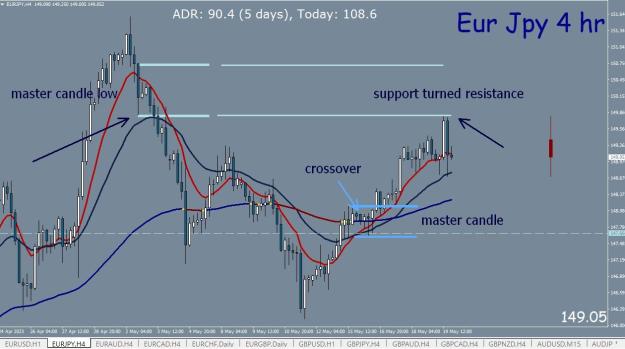
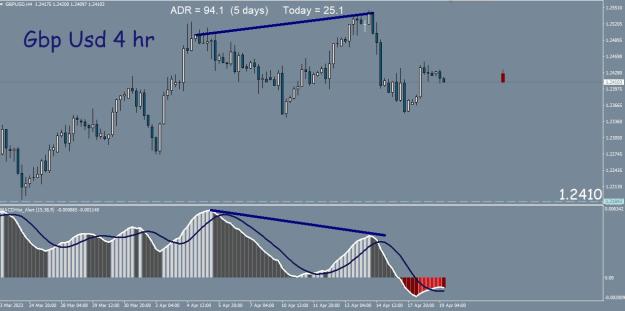
I hear you Alistair about EJ playing jokes. But this was a good trade from the crossover that I refer to on this chart. For good reasons we are all looking for support and resistance levels because we know how valuable they are to us as traders. One ...
MA Crossover System that works for me
- apo replied May 18, 2023
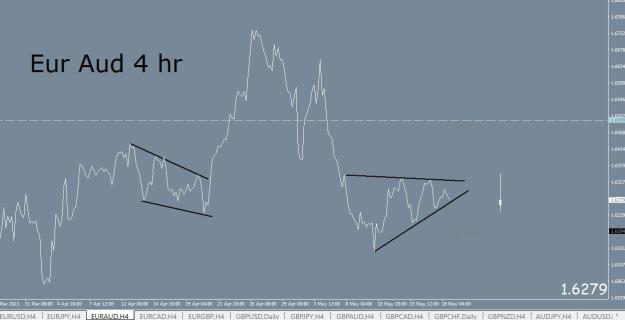
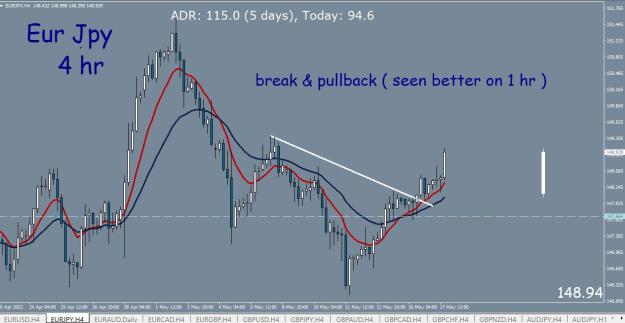
Hi AlistaireC...thank you for the welcome. Yes I read that section about the patterns. I try to always look for a confluence of reasons to enter a trade. The pattern is one. Right now the Eur Aud ( 4 hr ) looks like this to me.Two kind of similar ...
MA Crossover System that works for me
- apo replied May 17, 2023
Eur Aud already had a fake out of the upper trendline. Perhaps now a break of the lower TL will coincide with the MA's crossing over? image
MA Crossover System that works for me
- apo replied May 17, 2023
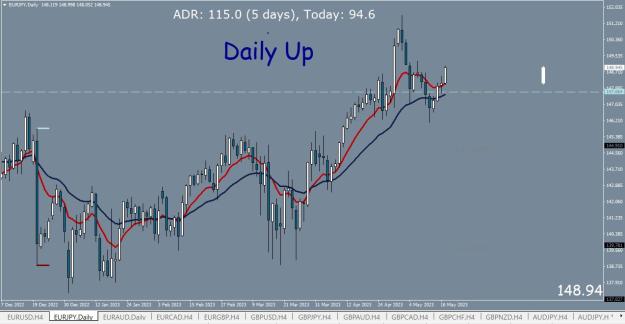
Hi AlistairC and all. thank you for the wonderful thread. I greatly appreciate your efforts. I'm currentrly still learning and demoing the strategy. image image
MA Crossover System that works for me
- apo replied Apr 19, 2023
Isn't "hind sight" wonderful ? image
Two systems in one - Very simple divergence strategy
- apo replied May 27, 2021
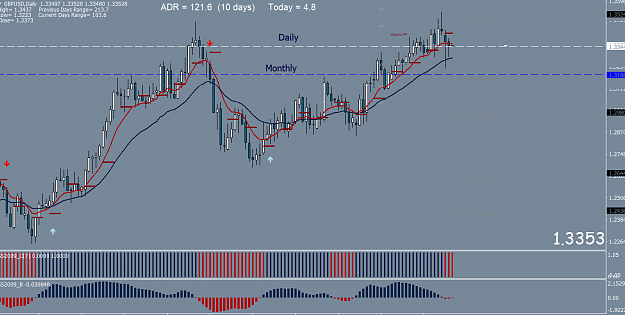
Hi all Would someone kindly provide a Laura template with the dashboard looking as it does in this chart ? I am struggling to get mine to mimic this one. Thank you your wonderful thread Laura and all contributors. image
Roadmap - A Way To Read Markets
- apo replied Mar 20, 2021
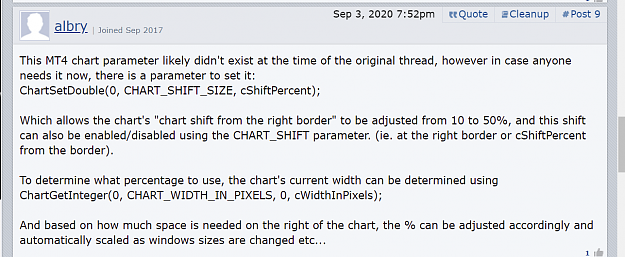
This is as close as I can get to solving this..but...I'm not a coder and am at a loss as to what to do with this advice. image url
Chart Shift Issue
- apo replied Dec 8, 2020
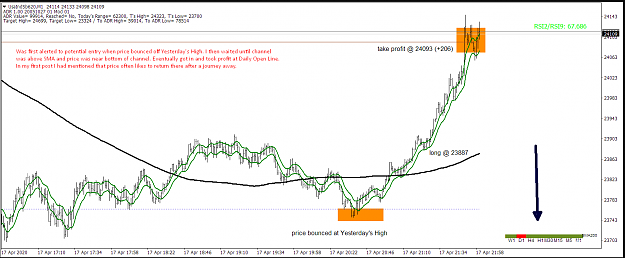
Hi Hutch Does this qualify as 'interesting' for your Daily strategy which you've posted here? Indis color change...blue > red ? ( please pardon that this is not a renko chart ) :-) Billy image
Renko trading using proven strategy
- apo replied Dec 1, 2020
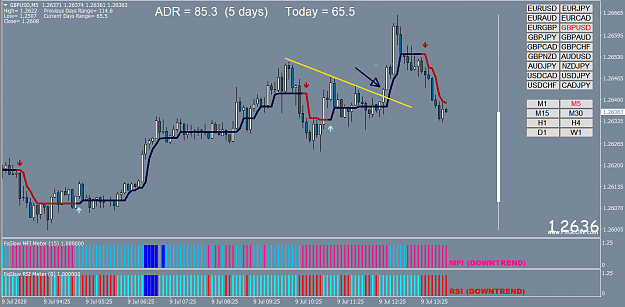
Hi guys. Here's something to watch for tomorrow. Still six hours left in the session. LOL...as I'm writing this post...the Eur Gbp dropped some 30 pips or so in a heartbeat. Lesson to self...always wait until bar closes. Thank you swilliam / Pollen ...
TMT Scalping System
- apo replied Feb 12, 2020
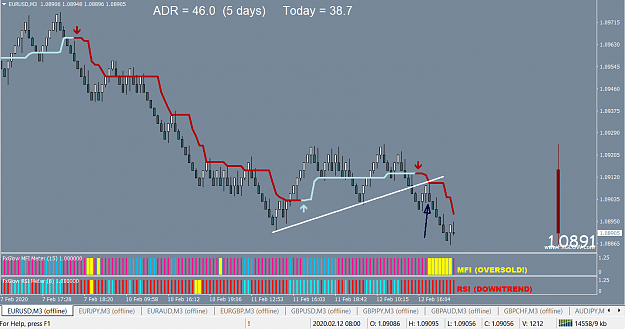
Testing the waters....( + 12 pips ). I'm using a 3 pip renko chart . image
TMT Scalping System
- apo replied Jun 25, 2015
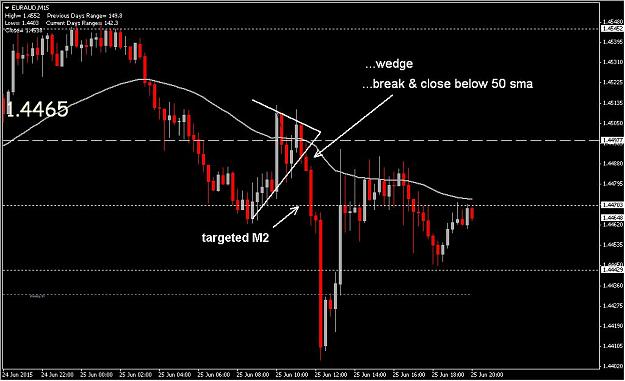
Eur Aud 15 min Hi all, It's the busy season for painting so not a lot of time for trading. But I see you guys are still 'knocking it out of the park'. This was a nice set up...exited way too early. But not complaining about 13 piparoonies. One day ...
Psych Levels, Pivots, and Trendlines - Resurrected
- apo replied Jun 10, 2015
Here's the 15 min view...also good.. image
Psych Levels, Pivots, and Trendlines - Resurrected
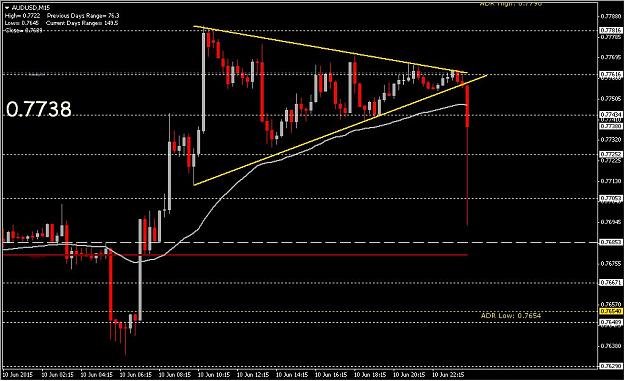
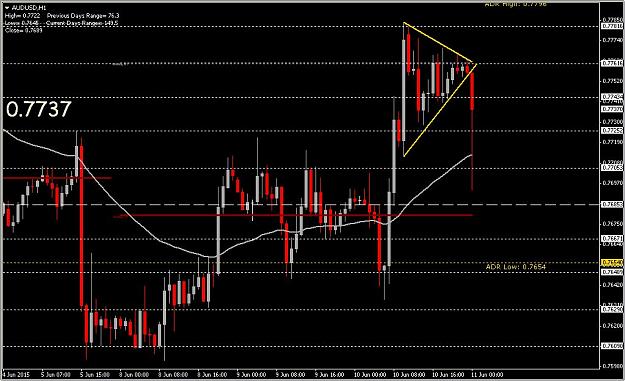
- apo replied Jun 10, 2015
Aud Usd hourly Here's a textbook set up.. but the report at 5:00 PM ( EST ) makes it untradeable for me. I know we trade mostly 15 min charts..but for demo purposes I'm searching out the patterns regardless of time frame. If this is an issue..in the ...
Psych Levels, Pivots, and Trendlines - Resurrected
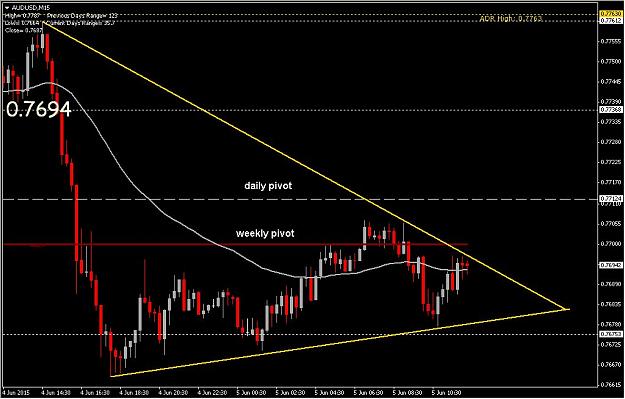
- apo replied Jun 5, 2015
Aud Usd 15 min ....waiting watching...but because of NFP I'm only observing. I haven't got the terminology down yet ( apologies ) but this is "coiling' for sure. image
Psych Levels, Pivots, and Trendlines - Resurrected