- Search Forex Factory
- 30 Results
-
 alegargano replied Oct 21, 2017
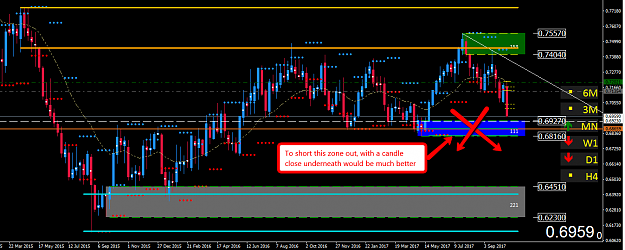
Hi to all, i'm back into this world, and today i've started to analyze some cross pairs. I want to share with you my thoughts on kiwi dollar. .MN uptrend, but MN SZ zone in controll Wk Downtrend, too low in the Wk curve. Demand zone nested with 50% ...
Supply and demand in a nutshell by Alfonso Moreno
- alegargano replied Sep 8, 2015
Hi Dvarrin, follow the numbers in the picture below image
Supply and demand in a nutshell by Alfonso Moreno
- alegargano replied Sep 5, 2015
ehm... john that is not demand, look the picture below image You want to be a swing trader, i'm a position trader because we have 2 different timeframe to entry. If you want to be a swing trader you have to know where you have to exit and then ...
Supply and demand in a nutshell by Alfonso Moreno
- alegargano replied Sep 4, 2015
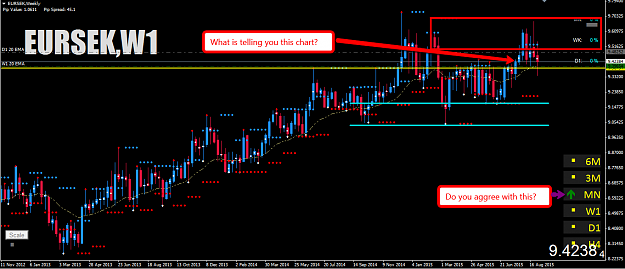
Hi my friend i'm qouting you because you have shared this chart. Is funny think that the charts are speaking to you so let me do this, Let me do a challenge with you: could you please tell me what is telling you this chart for the moment? (then i ...
Supply and demand in a nutshell by Alfonso Moreno
- alegargano replied Aug 28, 2015
that's ok, this is my wk chart, let's see what will happen image
Supply and demand in a nutshell by Alfonso Moreno
- alegargano replied Aug 26, 2015
Well it is good for you my friend
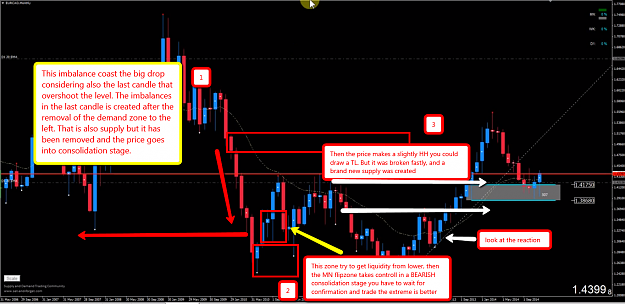
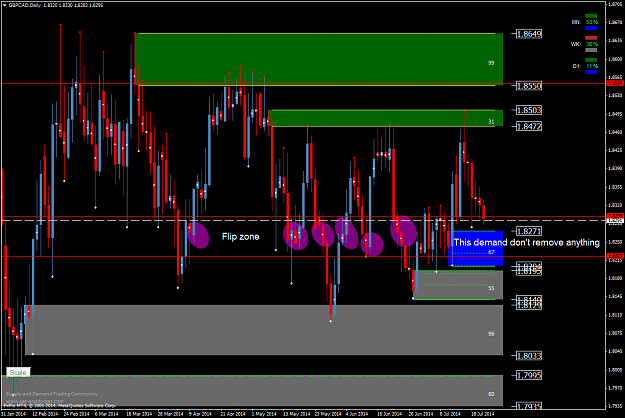
Supply and demand in a nutshell by Alfonso Moreno We are not yet in a bullish consolidation because as per the rules to have a bullish consolidation we have to remove one zone of demand, and\ or the price have to break the TL with one OHCL candle away. In this ...
- alegargano replied Aug 26, 2015
Another excercise that you could do is read letterarly the price action (a very helpful way to learn about the zones) Take a screenshot of a chart With paint or whatever software you want draw what you see. A cp is an horizzontal line a peak or a ...
Supply and demand in a nutshell by Alfonso Moreno
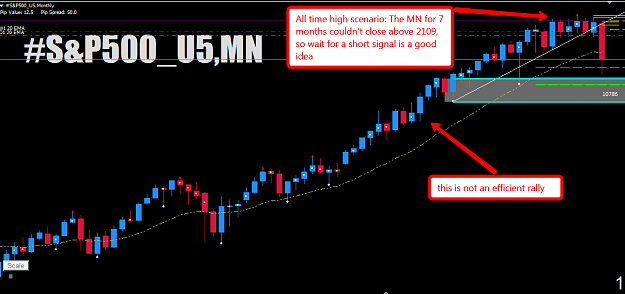
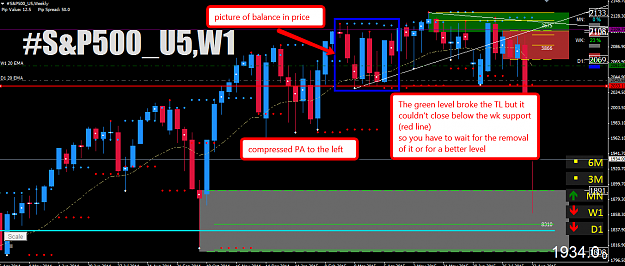
- alegargano replied Aug 25, 2015
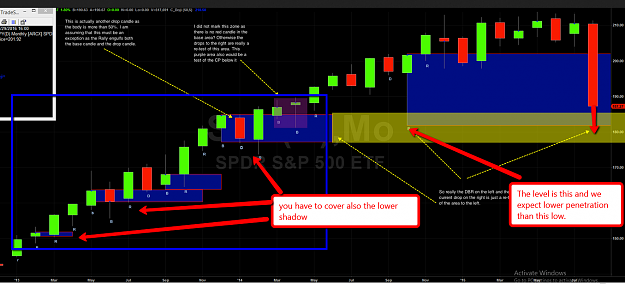
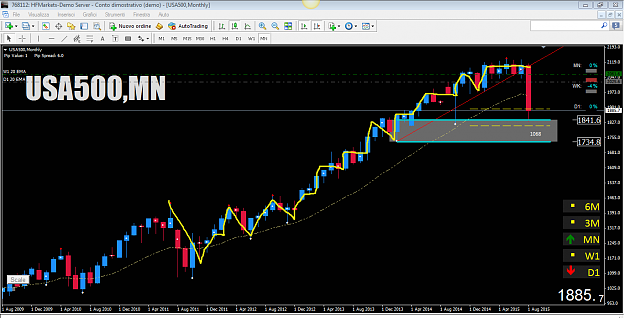
Yes for sure, for example the s&p 500 all time high scenario: MN and wk chart in the pictures. image image
Supply and demand in a nutshell by Alfonso Moreno
- alegargano replied Aug 27, 2014
Hi Larra, take a look at this two pictures: image Do you aggree with my trendline at 24/07/2014? try not to look at what happened next and proceed with the formation of HL and LL In this second picture can you see the broke of trendline the ...
Supply and demand in a nutshell by Alfonso Moreno

- alegargano replied Aug 27, 2014
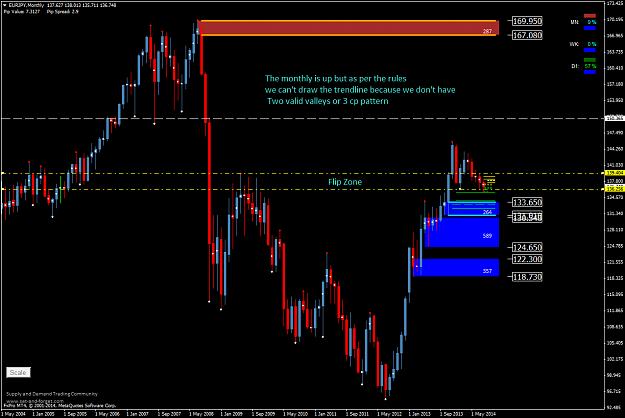
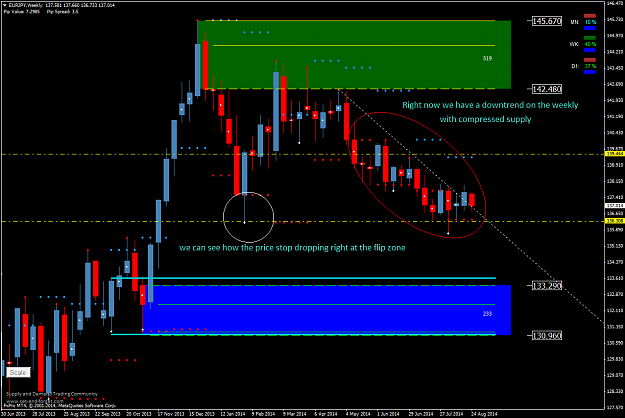
Hi Steve, i want to try to answer your question with this pictures: The monthly is up, and is important where the price is right now and what is it behavior in this point can you see it? image The weekly is DOWN because we have LH and LL use the ...
Supply and demand in a nutshell by Alfonso Moreno
- alegargano replied Aug 22, 2014
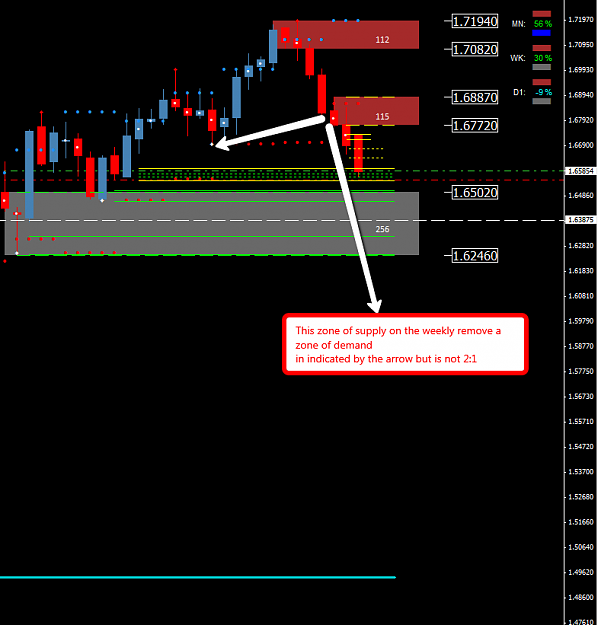
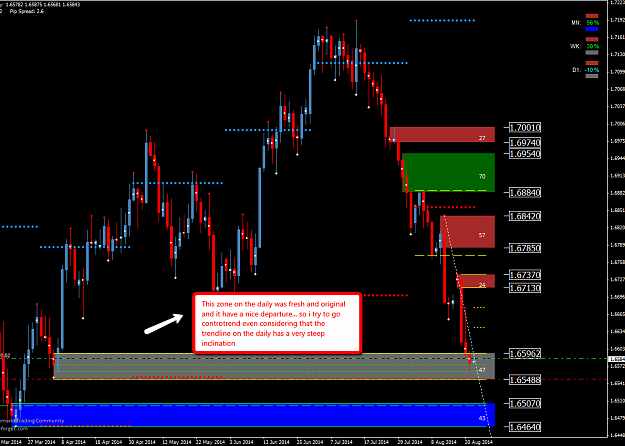
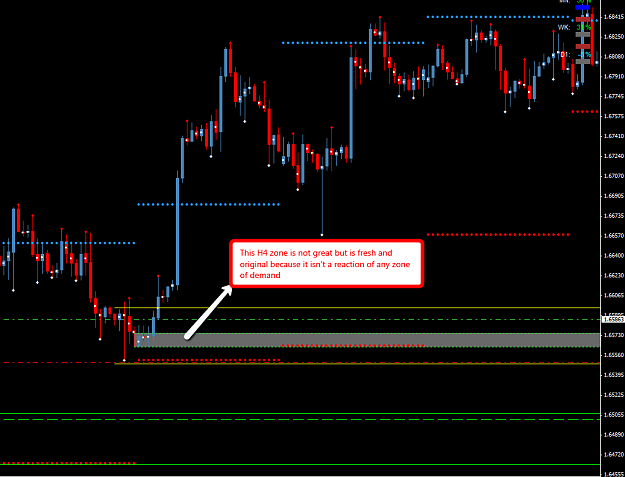
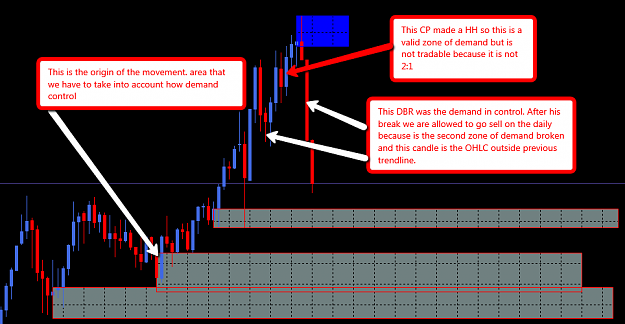
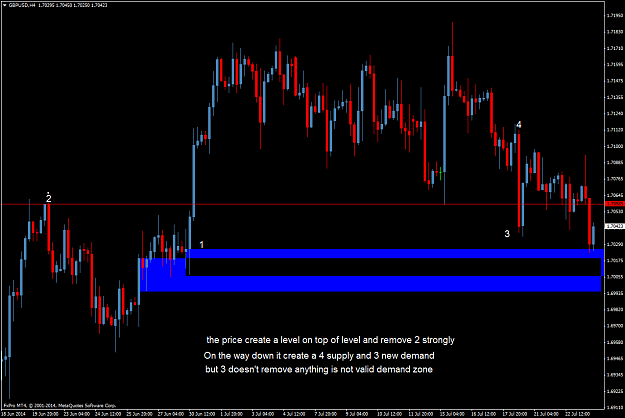
Hi to everybody and good morning! I want to share with you the reasoning that I did this morning on gpb\usd cross and my open DEMO trade: The first picture is of the weekly chart. We are in a level on top on level of demand zone that i don't drawn ...
Supply and demand in a nutshell by Alfonso Moreno
- alegargano replied Aug 2, 2014
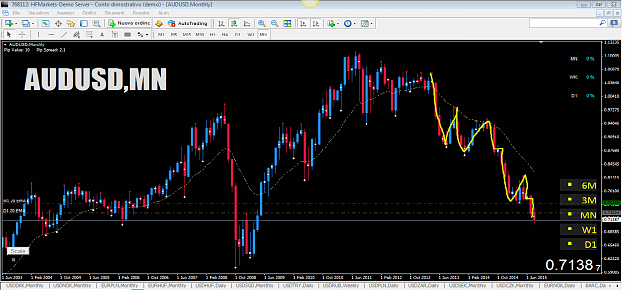
Hi to everybody, i've a question for you Alfonso: I'm doing my homework on forex tester. Right now I'm doing a test on aussie pair from 2007 to 20014. So far I've only had one up on the monthly trend but now I have the following situation. I'm ...
Supply and demand in a nutshell by Alfonso Moreno
- alegargano replied Jul 26, 2014
Hi Greg! Let me answer to your doubt about the engoulfing on what I can tell (I'm not an expert in this method but I think it's beautiful and instructive to confront and talk about it) so: We must draw a zone of demand from the highest open and/or ...
Supply and demand in a nutshell by Alfonso Moreno
- alegargano replied Jul 25, 2014
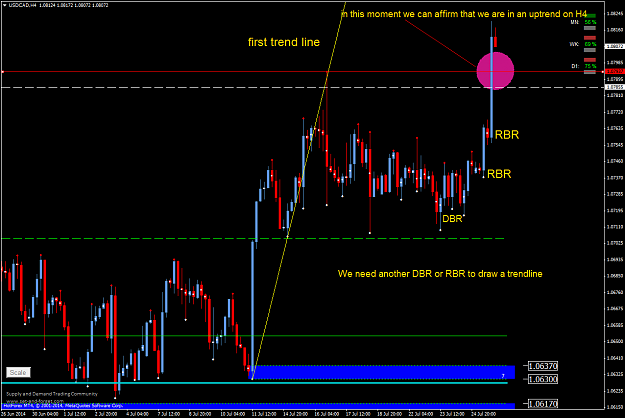
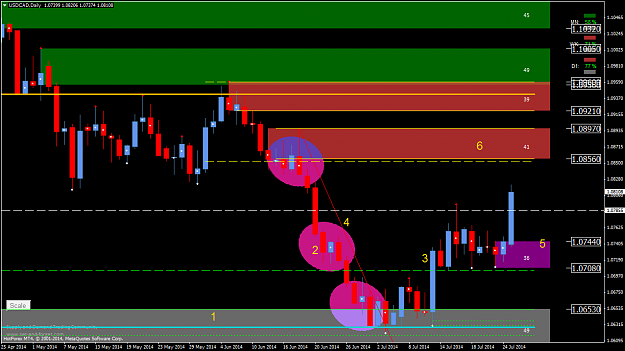
Hi everybody, i want to share with all of you a picture of a daily tf of usdcad pair. I do this like an exercise and i would be really happy to know what do you think about this little point of view: image 1 that zone was a tradable zone of ...
Supply and demand in a nutshell by Alfonso Moreno
- alegargano replied Jul 23, 2014
funny take a look at this image
Supply and demand in a nutshell by Alfonso Moreno
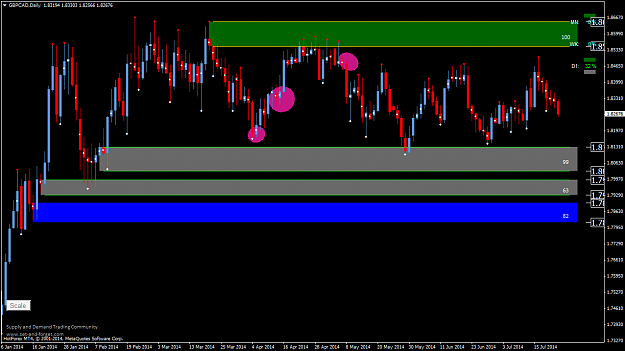
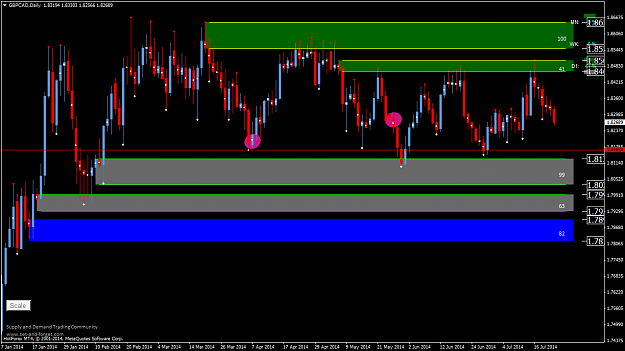
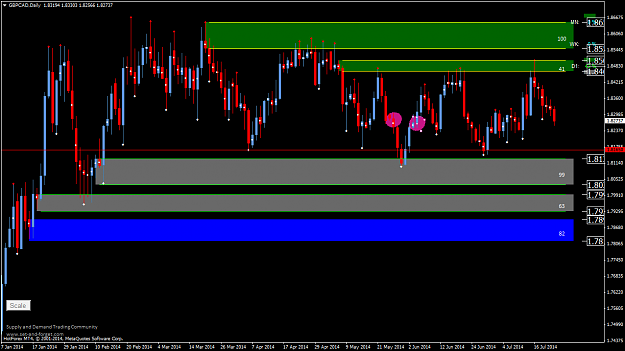
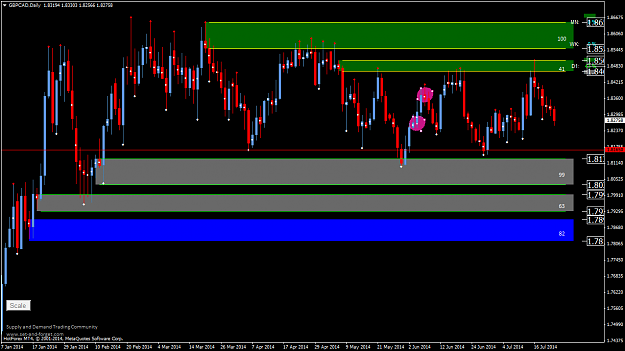
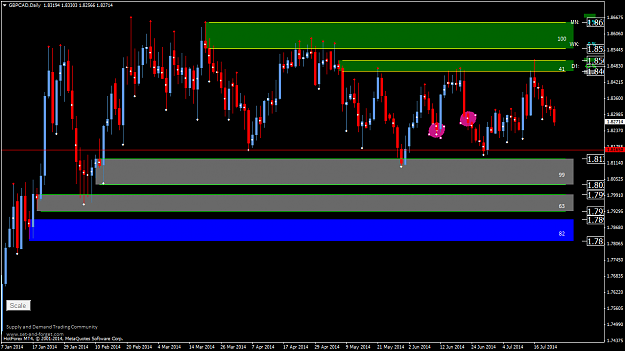
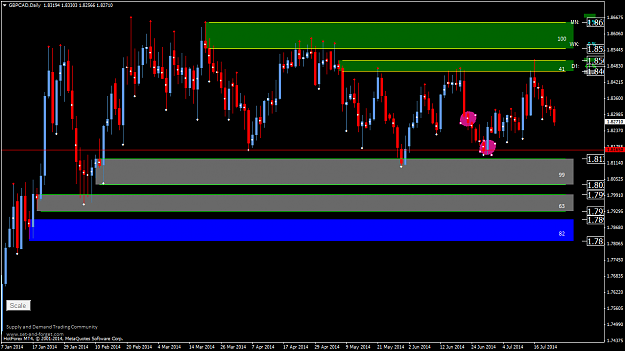
- alegargano replied Jul 23, 2014
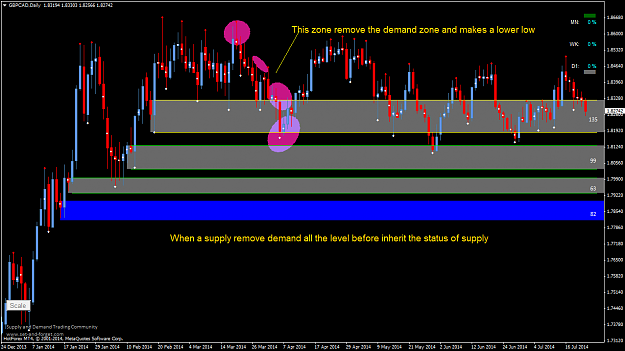
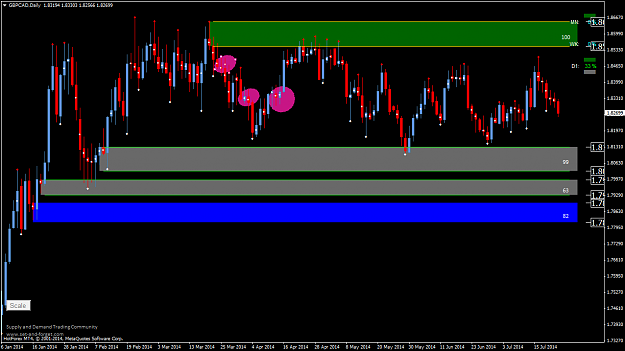
funnypips follow the pictures from the start, we always read the chart from the start of the situation. image image image image image image image image image if the area in the ellipse had removed the green area, then that area ...
Supply and demand in a nutshell by Alfonso Moreno
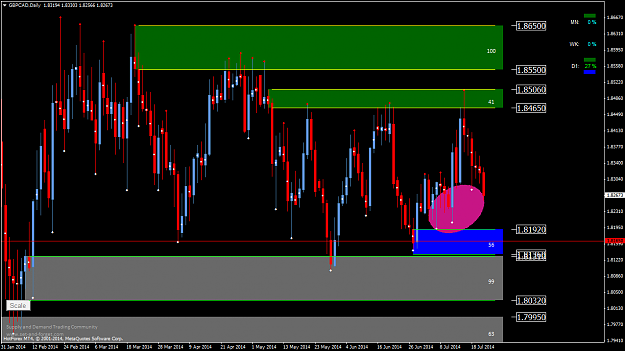
- alegargano replied Jul 23, 2014
Hi funnypip i want to try to answer your question with a chart. Before of that let me ask you What kind of trader you want to be? Position (monthly daily combination) or swing (Weekly h4 combination)? This question is important because if we can ...
Supply and demand in a nutshell by Alfonso Moreno
- alegargano replied Jul 23, 2014
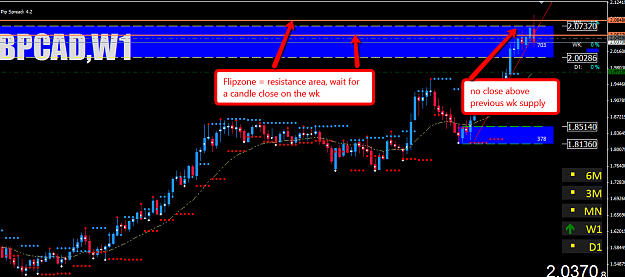
Hi Alfonso thank you for the reply, i went into confusion if we must waiting a closure above\belov the level or not... so the situation is something like this image
Supply and demand in a nutshell by Alfonso Moreno

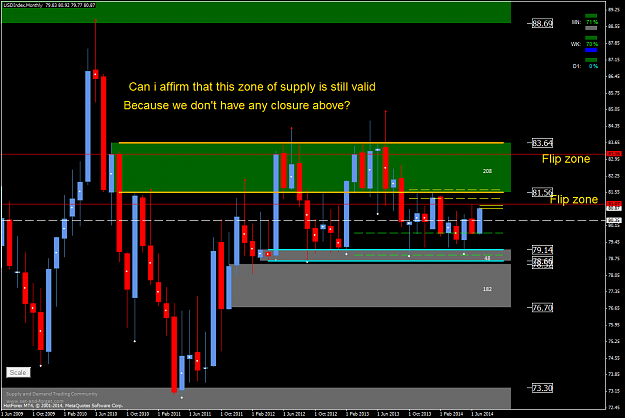
- alegargano replied Jul 22, 2014
Hi to all in the picture below i wrote my analysis on usd Index monthly. Are my thoughts correct? image
Supply and demand in a nutshell by Alfonso Moreno
- alegargano replied Jul 18, 2014
Good morning to all! Today is friday and i've finished the test work for this week and now i want to spend this day to take a look at the progres of the markets. This week i've started test with the curiosity to put my thoughts into practice and i ...
Supply and demand in a nutshell by Alfonso Moreno
