- Search Forex Factory
- 31 Results
-
 aky replied Nov 16, 2015
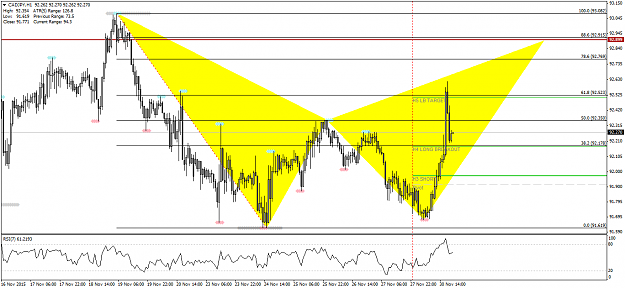
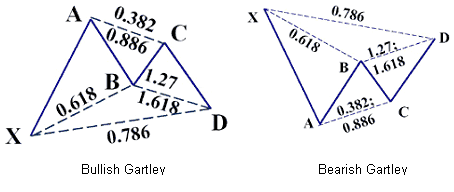
Hi Mohan, That isn't exactly a Gartley pattern. Here's the fib ratios for Gartley. image
askresearch
- aky replied Nov 16, 2015
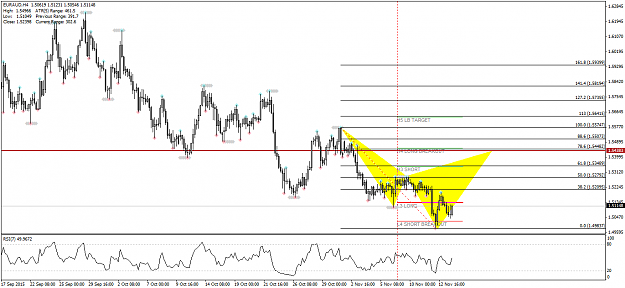
Nice. I'm watching a Cypher on higher timeframe (H4). image I did a quick check and seems like the B point (red Butterfly) on my chart didn't hit 78.6. But from your chart, it does seem to have touched the 78.6 level.
askresearch
- aky replied Nov 15, 2015
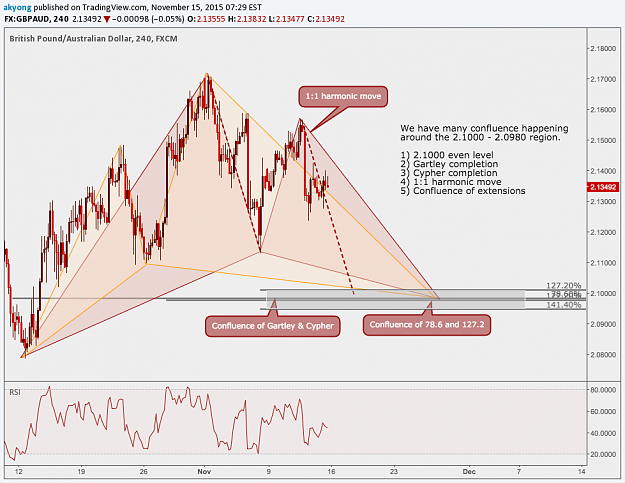
Keeping a close watch on this pair. image Many confluences happening around the 2.1000 - 2.0980 region. 1) 2.1000 even level 2) Gartley completion 3) Cypher completion 4) 1:1 harmonic move 5) Confluence of extensions
Ratios & Harmonics: a Different Way to Trade
- aky replied Nov 15, 2015
Keeping a close watch on this pair. image Many confluences happening around the 2.1000 - 2.0980 region. 1) 2.1000 even level 2) Gartley completion 3) Cypher completion 4) 1:1 harmonic move 5) Confluence of extensions
Making Bank: The Harmonic rhythm of the market

- aky replied Nov 15, 2015
Keeping a close watch on this pair. image Many confluences happening around the 2.1000 - 2.0980 region. 1) 2.1000 even level 2) Gartley completion 3) Cypher completion 4) 1:1 harmonic move 5) Confluence of extensions
Mr. Scott's Crayon Thread

- aky replied Nov 15, 2015
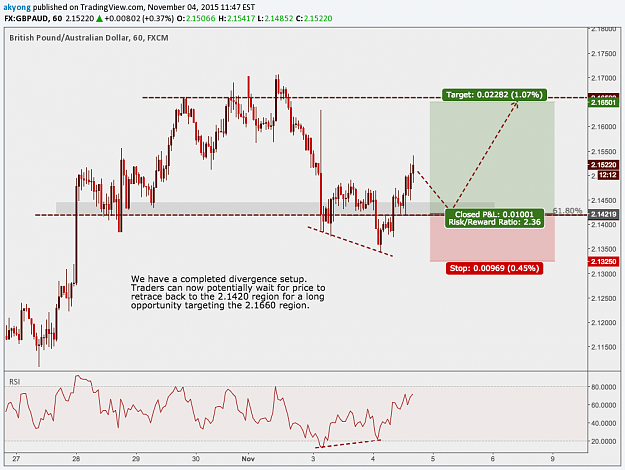
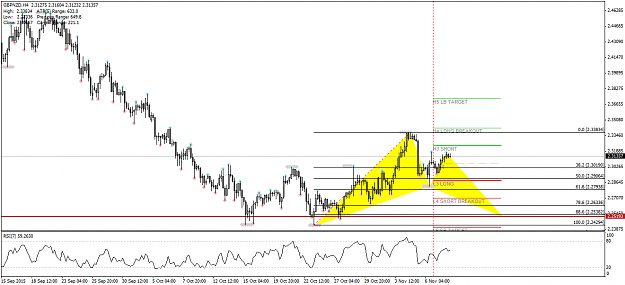
Potential trade of the week: GBPAUD image We have many confluences happening around the 2.1000 - 2.0980 region. 1) 2.1000 even level 2) Gartley completion 3) Cypher completion 4) 1:1 harmonic move 5) Confluence of extensions
askresearch

- aky replied Nov 13, 2015
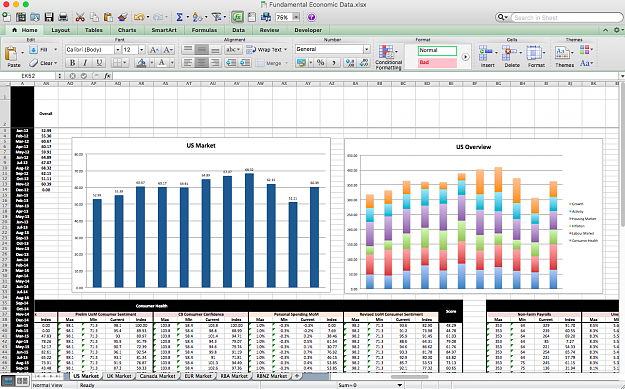
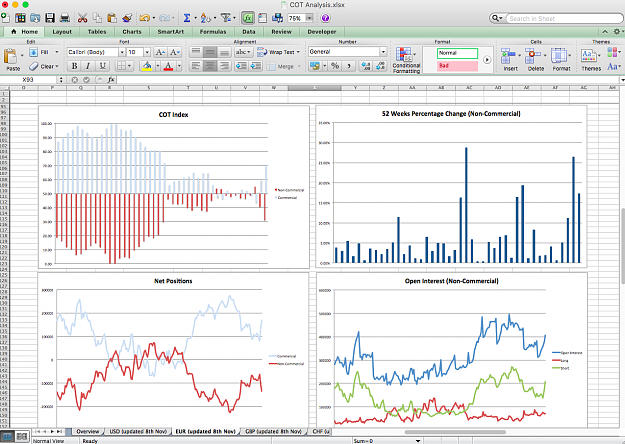
After completing the COT data file, we have added another new aspect into our methodology research - FUNDAMENTAL data. We will be incorporating ALL analysis - technical, fundamental & sentiment for the coming week! Keep you posted! image
askresearch
- aky replied Nov 13, 2015
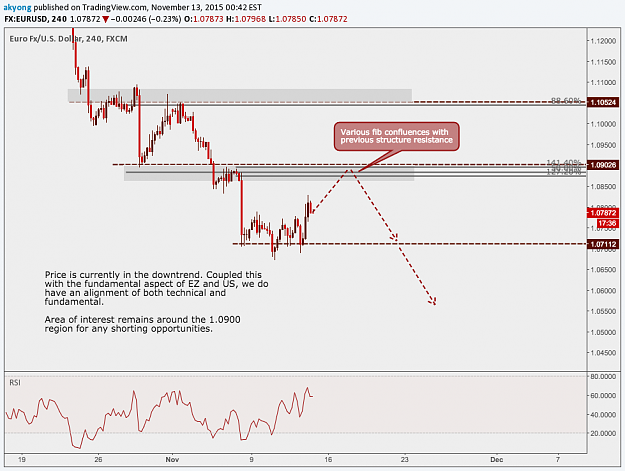
Here's my view on EURUSD. Perhaps you want to include a chart so we can better discuss. With the chart, we can also clearly see which timeframe we are analysing as at different timeframe, the analysis would be quite different. image
askresearch
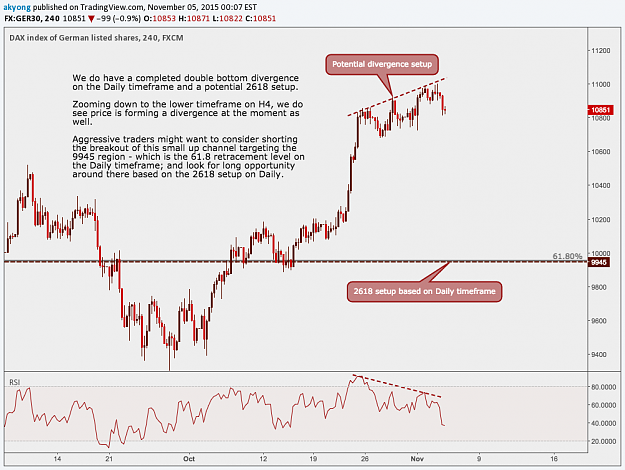
- aky replied Nov 13, 2015
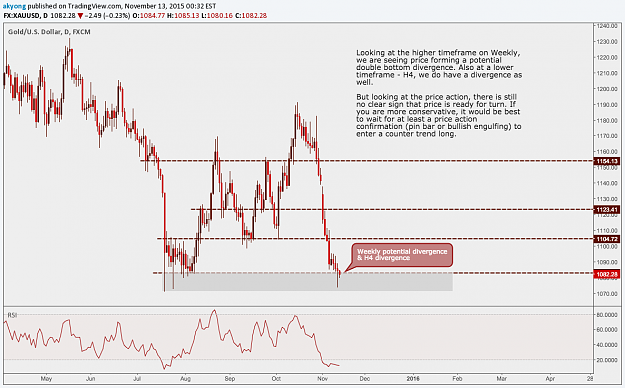
If you are looking at Weekly timeframe, it is a potential double bottom divergence. But since the bar for the week is still active, it is still "potential". If you drop down to H4, we do see a divergence as well. Having said that, there isn't any ...
askresearch
- aky replied Nov 11, 2015
Hi all, Thought of contributing some of the pairs in my watch list too. More of the higher timeframe. image image image
Mr. Scott's Crayon Thread
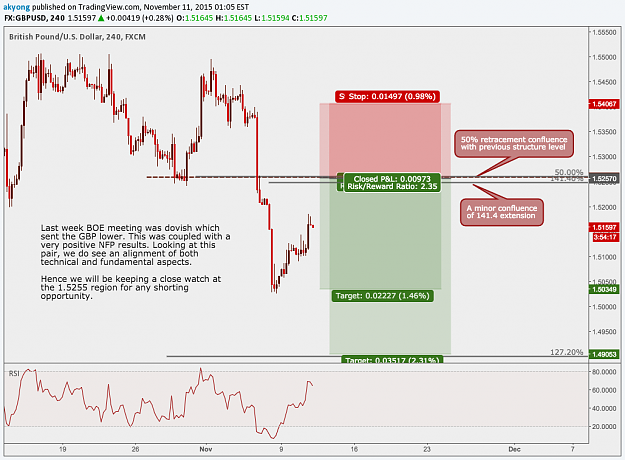
- aky replied Nov 11, 2015
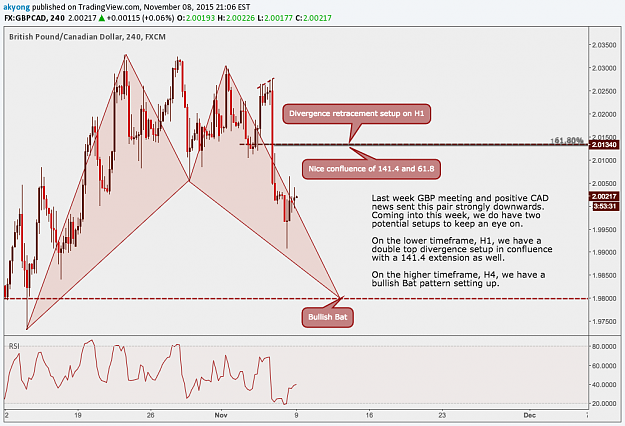
Last week BOE meeting was dovish which sent the Pound lower. This was coupled with a very positive NFP results. Looking at this pair, we do see an alignment of both technical and fundamental aspects. Hence we will be keeping a close watch at the ...
askresearch
- aky replied Nov 10, 2015
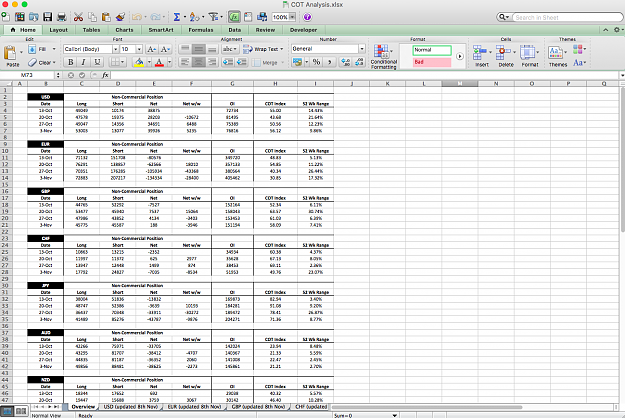
Finally compiled and done up the COT data file. Starting next week we will be adding sentiment analysis to our research methodology! We never stop equipping ourselves with new insights to continuously develop our methodology. And you shouldn't stop ...
askresearch
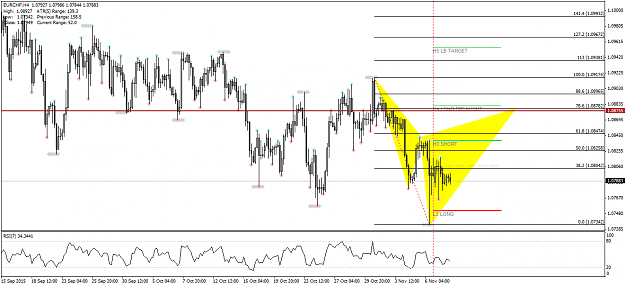
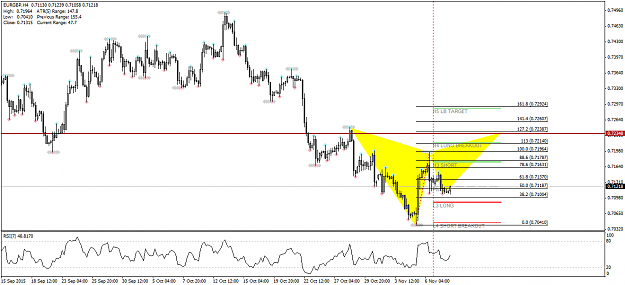
- aky replied Nov 9, 2015
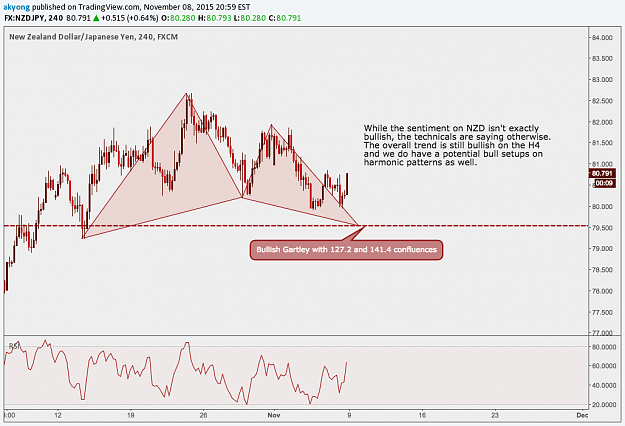
I'm having these 3 in my watchlist since we are having some major news data releases on AUD, NZD and GBP this week
Ratios & Harmonics: a Different Way to Trade image image image

- aky replied Nov 8, 2015
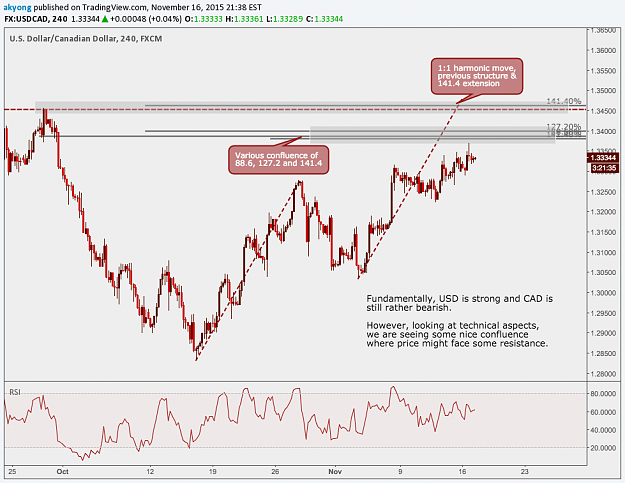
Last week GBP meeting and positive CAD news sent this pair strongly downwards. Coming into this week, we do have two potential setups to keep an eye on. On the lower timeframe, H1, we have a double top divergence setup in confluence with a 141.4 ...
GBPCAD
- aky replied Nov 8, 2015
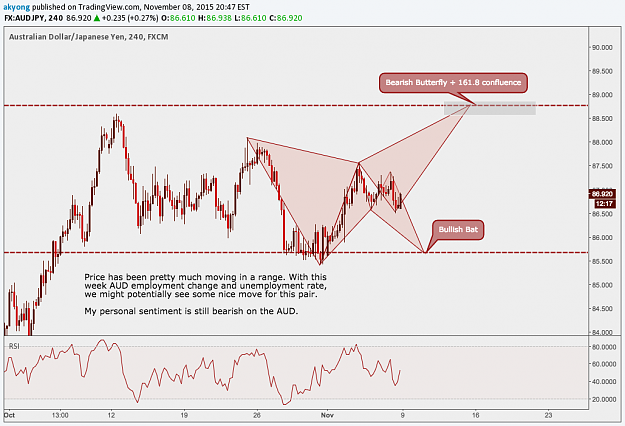
Price has been pretty much moving in a range. With this week AUD employment change and unemployment rate, we might potentially see some nice move for this pair. My personal sentiment is still bearish on the AUD. image
AUD/JPY

- aky replied Nov 8, 2015
Looking at this week news events, here are 3 potential setups to keep an eye on
askresearch Price has been pretty much moving in a range. With this week AUD employment change and unemployment rate, we might potentially see some nice move for this pair. My ...


- aky replied Nov 5, 2015
In this video, I'll share with you exactly how we spot potential setups using the RSI indicator. The setting for the RSI is period 7, with overbought and oversold conditions at 80 and 20 respectively. image
askresearch