- Search Forex Factory
- 123 Results (4 Threads , 119 Replies )
-
 Willowgal replied Aug 27, 2015
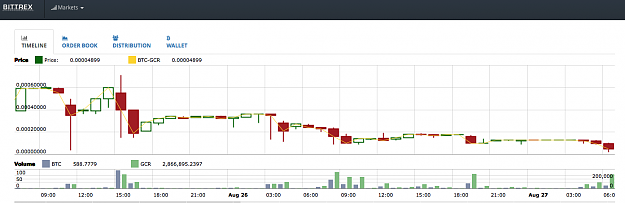
url This is not a Forex market, but I'd appreciate an expert VSA analysis of this crypto currency chart... anyone got opinions? image
vsa with Malcolm
- Willowgal replied Jan 29, 2013
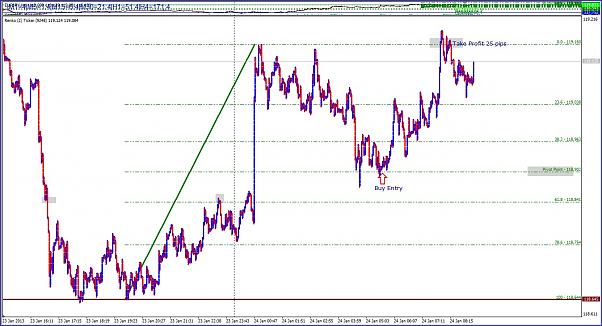
25 pips up. Some profit taken and SL set at BE on the rest
Scalping away with 1/3pip Renko charts
- Willowgal replied Jan 29, 2013
Just gone long GJ at 142.77 SL 142.45 Target 143.42
Scalping away with 1/3pip Renko charts
- Willowgal replied Jan 26, 2013
On chart 11 - price gets to D. This is the original 23.6% level 90.80 (see chart 3) I drew and price gets there for the first time again. Sure enough it bounced away for a 25-30 pip move. Price gets to point E (which happens to be the first time it ...
Scalping away with 1/3pip Renko charts
- Willowgal replied Jan 26, 2013
Now I look for either a) Price levels we return to for a bounce (see point B on chart 10) or b) New mini trends form, retrace and then get in at the appropriate fib levels to get in the continuation of the trend. Chart 10 shows a good scalp setup at ...
Scalping away with 1/3pip Renko charts
- Willowgal replied Jan 26, 2013
and then price reverses.... (see chart 9)
Scalping away with 1/3pip Renko charts
- Willowgal replied Jan 26, 2013
Second Profit target is hit (see chart 8).
Scalping away with 1/3pip Renko charts
- Willowgal replied Jan 26, 2013
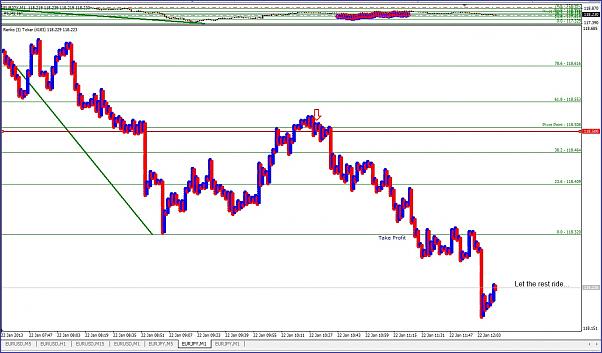
To have a look at the 'bigger picture' I go to the 1 minute candles chart (everything is relative!!). As we can see nothing to the left as far I let the long trade ride, moving my stop a few pips below each subsequent higher swing low in the move. ...
Scalping away with 1/3pip Renko charts
- Willowgal replied Jan 26, 2013
We hit the first Profit Target in screen 6. I then watch price action and also look on the candles chart to the left to see if there are any obvious levels of resistance which are likely to stop the move going much further.
Scalping away with 1/3pip Renko charts
- Willowgal replied Jan 26, 2013
After briefly falling through this level, price quickly reacted and this is where I go Long at around 90.69. 1st Profit Target: Swing High 90.90 (21 pips). Stop loss 3 pips below 78.6% retracement level 90.52 (17 pips) 2nd Profit Target: 45 pips + ...
Scalping away with 1/3pip Renko charts
- Willowgal replied Jan 26, 2013
On screen 4 we can see that price, having respected the 38.2% level on many occasions, has now retraced down to approach 90.68, the 50% retracement (or Pivot) level. Time to closely start watching price action ....
Scalping away with 1/3pip Renko charts
- Willowgal replied Jan 26, 2013
Then, I go to the Renko chart and draw these price lines in manually (rather being able to use the fib tool to do it for me). Then mark off which of these levels have shown previous 'interest' on the upmove. Both the 50% and 61.8% levels did this, ...
Scalping away with 1/3pip Renko charts
- Willowgal replied Jan 26, 2013
I checked the candles chart at this stage to see if 90.57 was the real low of the move. As you can see in screen 2 it wasn't - the move actually started around 7:19am GMT at price 90.45. So this was a mini 45 pip Uptrend before it retraces. (this ...
Scalping away with 1/3pip Renko charts
- Willowgal replied Jan 26, 2013
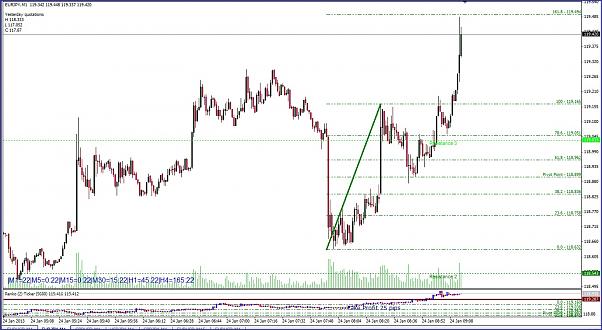
Here is how I traded yesterday's USDJPY pair (Friday 25 Jan 2013) Around 8.50am UK time set the Renko Ticket Box indicator off (on a USDJPY 1 minute chart) to build price background data (I would usually start this off around 6am to get at least a ...
Scalping away with 1/3pip Renko charts
- Willowgal replied Jan 24, 2013
Nice start to the day with a 25 pip trade long on the EJ. The key is to wait for an impulsive trend to identify itself, and then wait for the retracement to reach one of the levels. Safe target is the previous High (UT) or Low (DT). The other target ...
Scalping away with 1/3pip Renko charts
- Willowgal replied Jan 23, 2013
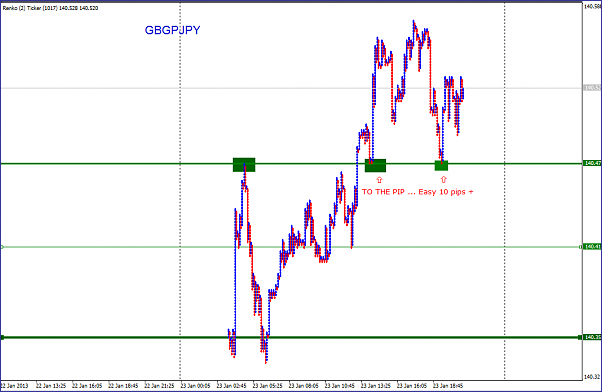
A good example of how reliable the short term S/R levels are for a couple of 10 to 20 pip scalps Here is a GBPJPY chart that hits perfectly on a previous resistance price level that has become support
Scalping away with 1/3pip Renko charts
- Willowgal replied Jan 23, 2013
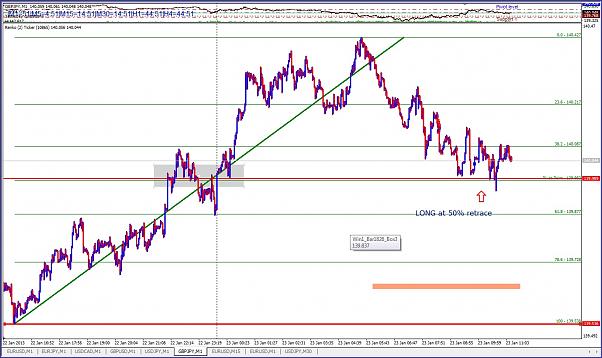
Worked out well - first profit taken at Swing High, +40pips. I set the Renk charts going for a couple of hours of a few pairs and then look for one with an obvious trend. Then I put simple fibs on the move and look for likely retracement turning ...
Scalping away with 1/3pip Renko charts
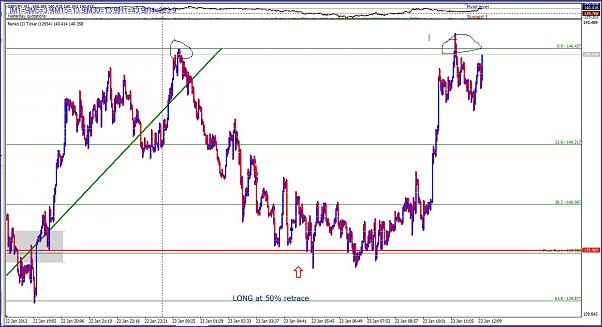
- Willowgal replied Jan 23, 2013
A nice GBPJPY set up earlier today: Entry Long @ 139.98 - 50% retracement of up trend, and also the price level showed 'action' on the way up. Expect this to become resistance to the retracement down. Target: Swing High of 140.42
Scalping away with 1/3pip Renko charts
- Willowgal replied Jan 22, 2013
Spud, I would be really interested which price levels you marked today from this chart ? Thanks
Volume Price Level Trading
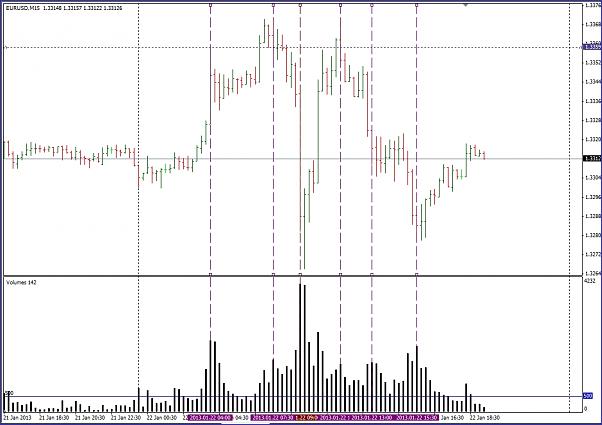
- Willowgal replied Jan 22, 2013
The trade went as I hoped and bagged 16 pips at the Take Profit level. If you want to load this onto your charts, you need to set it up and let it run for a good half hour before thinking of trading as the data builds up over time from scratch in ...
Scalping away with 1/3pip Renko charts