- Search Forex Factory
- 24 Results
-
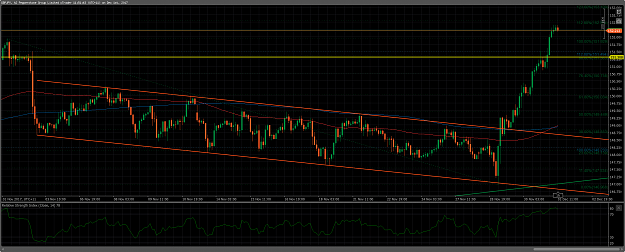
 WhiteMouseFX replied Feb 13, 2020
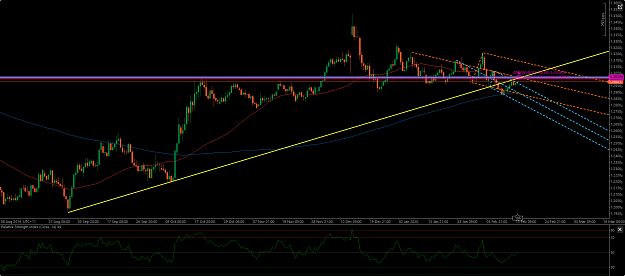
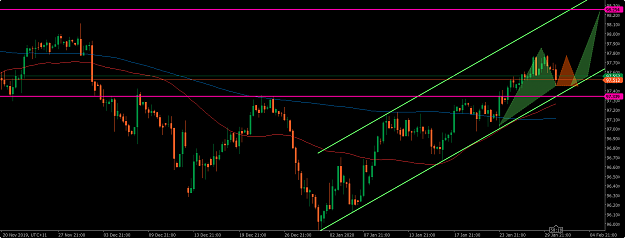
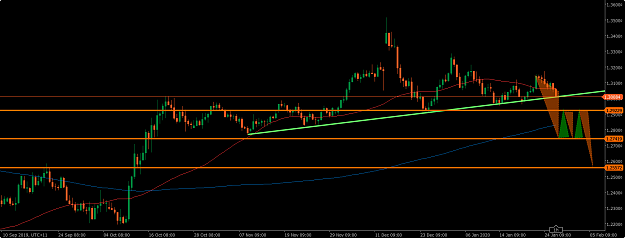
Just another bearish scenario using Aquaman's Trident
Cable Update (GBPUSD) Cheers and have fun like I do. image image
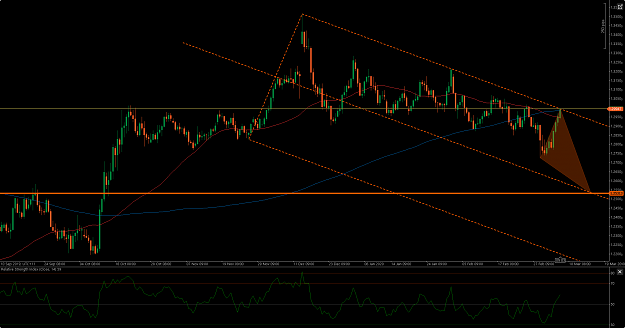
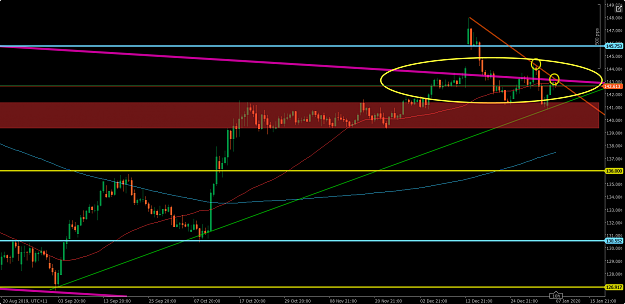
- WhiteMouseFX replied Feb 11, 2020
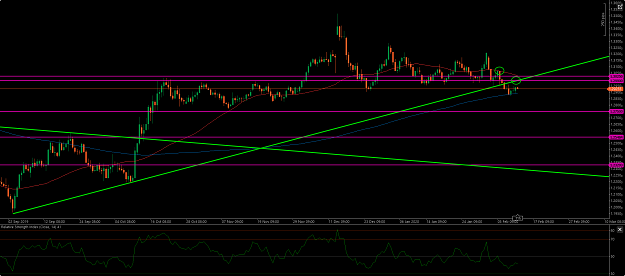
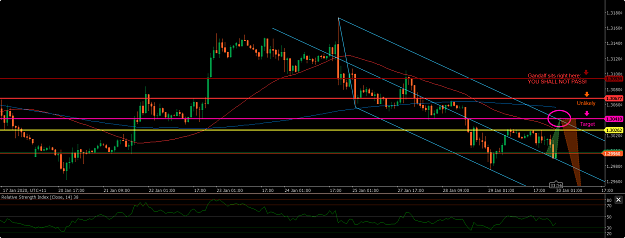
Still bearish... But before that, it's possible a 2990-3025 retest. It would make sense once price broke through Sep 2019 crescent support line last week. Watch out. Cheers. image
Cable Update (GBPUSD)
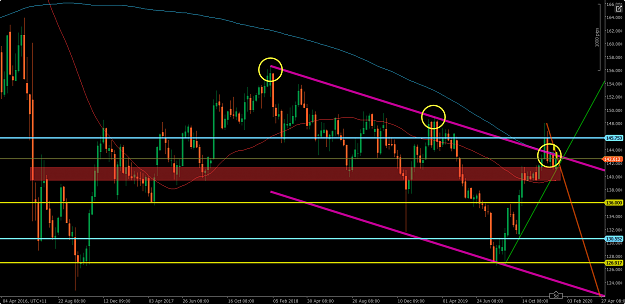
- WhiteMouseFX replied Feb 9, 2020
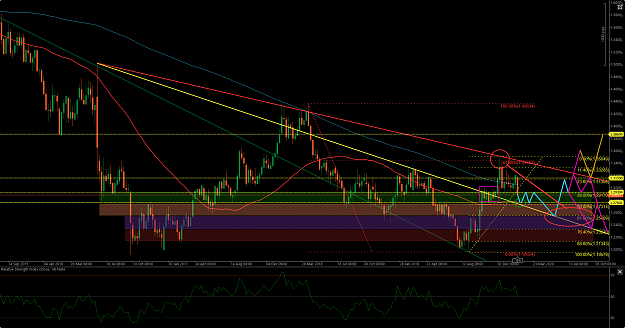
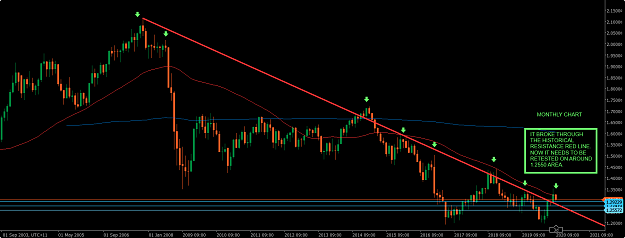
Does anyone here trade Fibonacci retracement levels in different time frames? I see only very few posts about it. No many ideas to exchange at all. SMA 50 on the weekly time frame is pointing: The next bounce at Fib 50% retracement Historically ...
Cable Update (GBPUSD)
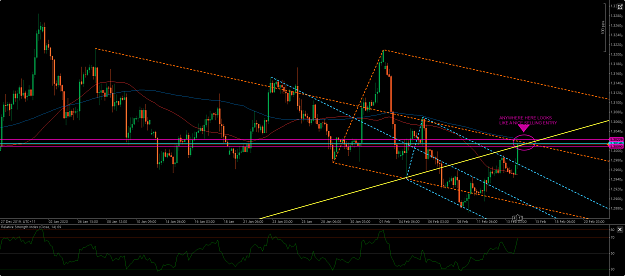
- WhiteMouseFX replied Feb 6, 2020
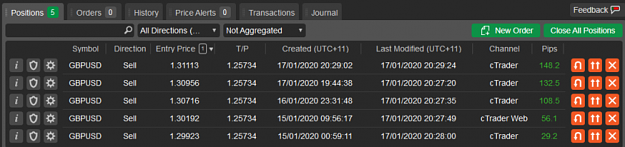
Waiting time maybe? That's why I'm saying that. image
Cable Update (GBPUSD)
- WhiteMouseFX replied Feb 4, 2020
Extremely Angry Bear here in Australia...
Cable Update (GBPUSD)
 image
image


- WhiteMouseFX replied Jan 30, 2020
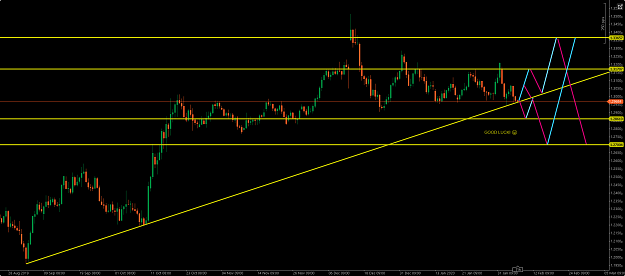
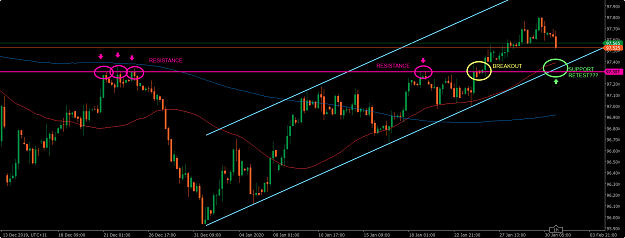
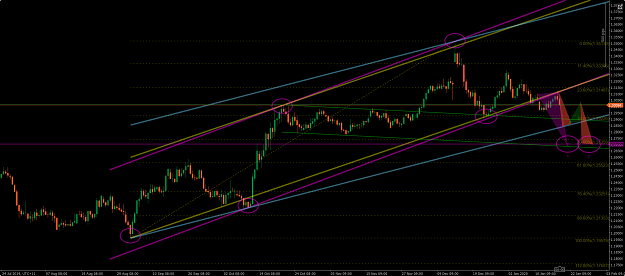
Yep. I'm targeting that too. It doesn't seem it will go down much more now. It will come back to retest the breakout on 97.34 at some point. It's possible to sidewalk until Monday. Then up. Exact time to touch the bottom line of the crescent ...
Cable Update (GBPUSD)
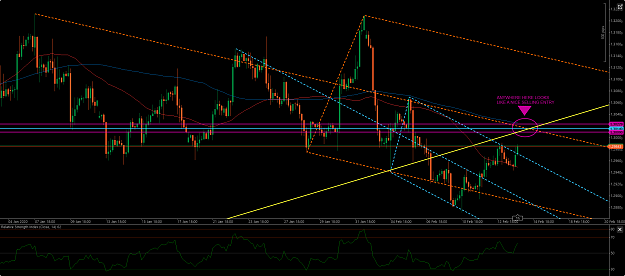
- WhiteMouseFX replied Jan 30, 2020
GBP is only moving because of USDX. Very strong reversal expected. Have a look at DX and tell me what you guys think. image
Cable Update (GBPUSD)
- WhiteMouseFX replied Jan 29, 2020
A small push to the north, but maybe not enough to break through and hold above the top of Andrew's Pitchfork: image
Cable Update (GBPUSD)
- WhiteMouseFX replied Jan 28, 2020
image image image Fasten your seat belts and pin this post.
Cable Update (GBPUSD)
- WhiteMouseFX replied Jan 18, 2020
My bias downside predictions in one 12h chart [let's see] image
Cable Update (GBPUSD)
- WhiteMouseFX replied May 24, 2018
I posted this chart analysis (2Day) about a week ago. That's what, how and why I'm seeing 0.7660 as my area of interest. After that, I see a potential sell of 400+ pips for the Aussie. So far so good.
AUD/USD

- WhiteMouseFX replied May 8, 2018
Are you guys paying attention to the fact the bottom of a 2-year raising channel could be at 0.7176-0.7221 zone? Analysis on 2-day chart, have a look. 127% Fib expansion from A1 B1 C1 The 27% Fib level is expected from A1 B2 C2 This could confirm ...
AUD/USD
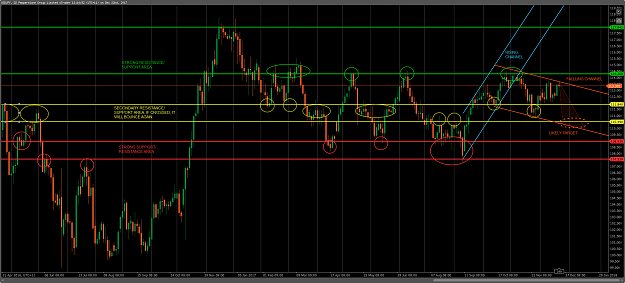
- WhiteMouseFX replied Dec 21, 2017
Hi guys! USDJPY definitely can't be ignored, right? So, this is my analysis for USDJPY on 2D chart. Based on this analysis, which is valid only if USDJPY doesn't break at the top of the indicated falling channel, we can consider: (1) for a weak GDP, ...
Dragon Riders GBP/JPY
- WhiteMouseFX replied Nov 30, 2017
Hahaha, I had a glitch indeed, but it happened with USDJPY only, the position was opened yesterday at 116.xx, crazy thing, 500 pips negative, but problem solved. About this GDPJPY ride, just have a look in what I said 02 days ago about the Falling ...
Dragon Riders GBP/JPY