- Search Forex Factory
- 35 Results (1 Thread , 34 Replies )

-
 Val144 replied Sep 3, 2008
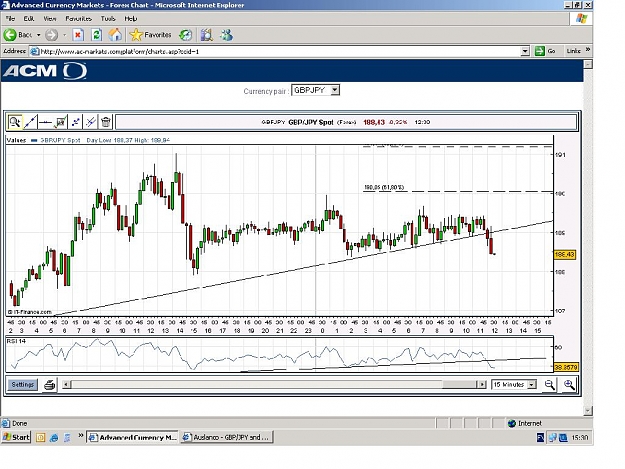
GJ price is going down. UJ should thank soon. GU is extremly weak. Like Karmo my target is around 187.xx - 188.00. Chart tells more then me.
Auslanco - GBP/JPY and GBP/USD (newstrade)

- Val144 replied Aug 31, 2008
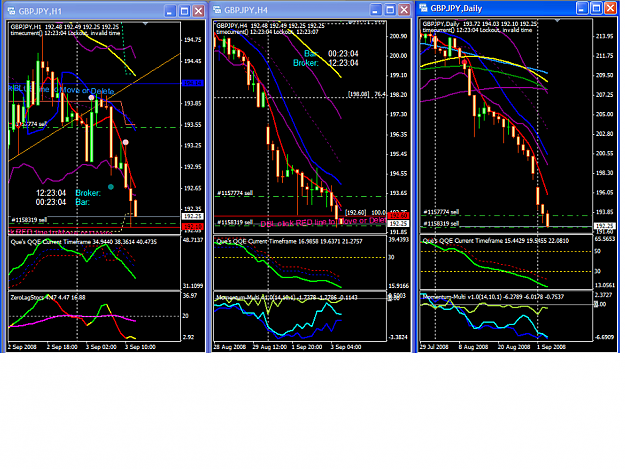
bias still is very antibullish
Auslanco - GBP/JPY and GBP/USD (newstrade)
- Val144 replied Aug 8, 2008
Double top ~211.60. Close my long scalp for +25pips.
Auslanco - GBP/JPY and GBP/USD (newstrade)
- Val144 replied Aug 8, 2008
OK my long survives for now. My EA close trade only if three consecutive 1 minute candles close below selected SL level.
Auslanco - GBP/JPY and GBP/USD (newstrade)

- Val144 replied Aug 8, 2008
4H GJ chart zl MACD -up stoch - up price oversold go long @211.40/50 TP1 - 213.60/80 TP2 - 214.50/60 SL - 210.90
Auslanco - GBP/JPY and GBP/USD (newstrade)
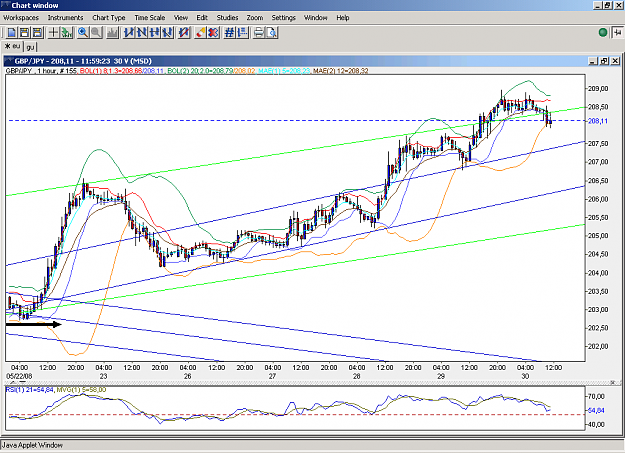
- Val144 replied Jul 30, 2008
Hi peaches, Scrat & Karmo, I think so
Auslanco - GBP/JPY and GBP/USD (newstrade) , but dollar becomes stronger and NFP is possible to be better then expected. That worried me to go short ATM. I find that picture on some other tread.

- Val144 replied Jun 29, 2008
Why I use macd on Aus thread. Thay show very close signals all the time. I use a different charting systems and only some of them has qqe indicator.
Auslanco - GBP/JPY and GBP/USD (newstrade)
- Val144 replied Jun 29, 2008
Re GY and next week — Price is near the top of weekly down regression channel. I see a doji on weekly, which suggest that bulls lost power. Macd cross zero line and rising. M10 is positive and going down. M14 is negative without clear ...
Auslanco - GBP/JPY and GBP/USD (newstrade)
- Val144 replied Jun 27, 2008
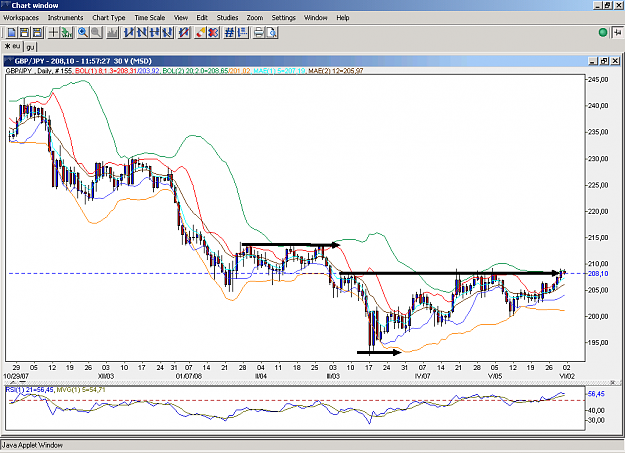
I see a big correction to weekly 5 sms @209.87. Weekly momentum is bearish and weekly DTL is in takt for now and below weekly 5 sma. Price bounce from weekly 200 ema.
Auslanco - GBP/JPY and GBP/USD (newstrade)
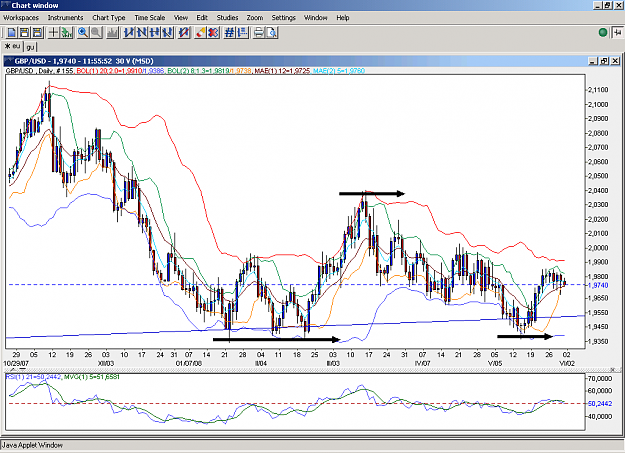
- Val144 replied May 30, 2008
i see 203 area as first target for next big movement.
Auslanco - GBP/JPY and GBP/USD (newstrade)

- Val144 replied May 19, 2008
Now I am at work. Has just mobile connection to my broker. Screen is just 2.7” & I use some other charting package. That is weekly chart for GJ. Price is above 5 sma. Momentum is up and if break achieved on the up side next target I see between 208 ...
Gann Analysis
- Val144 replied May 11, 2008
209 or 192 — That is my chart. It say a lot.
Auslanco - GBP/JPY and GBP/USD (newstrade)
- Val144 replied May 10, 2008
bottom is around 200-198.60 — That is not a Gann analysis. I post it just to conform your analysis. My 4H chart with FIBO levels shows that we are around 50% retracement level. I start to load longs, and will load them up to 61.8% level. Stop ...
Gann Analysis


- Val144 replied May 6, 2008
Re: Daily Gann-Hilo — Karmo tks for your post. Sory for my post. That is my Daily chart. For the first time I see diference betwin MT4 & VT Gann-Hilo 10. Sould bemore careful in a future.
Auslanco - GBP/JPY and GBP/USD (newstrade)
- Val144 replied May 2, 2008
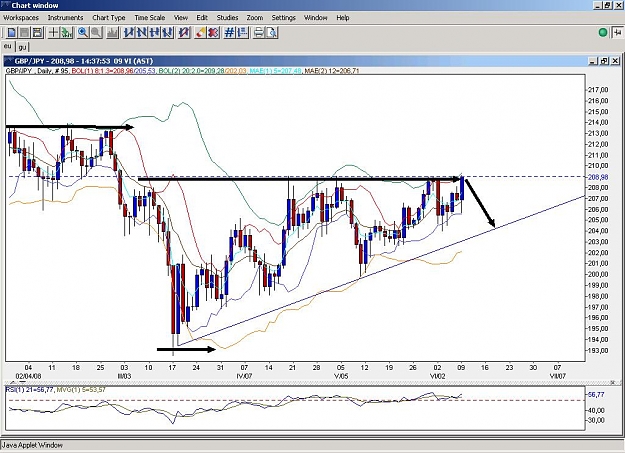
My chart show too much. I use Gann-Hilo10 & Gann-Hilo 14, QUE 20 & QUE 5, MACD (8,17,9). I am looking for better enter point, maybe 205 or 204.60.
Auslanco - GBP/JPY and GBP/USD (newstrade)
- Val144 replied Mar 12, 2008
my daily chart show some room & gj may go up to 50% or 61.8%. gu daily chart show a bigest posibility to see down move next days. that will prevent gj from posibility to go up to much.
Karmo's trading strategy trading GBP/JPY that is what I see on the charts... any comments are ...
- Val144 replied Feb 14, 2008
I see that on my chart. It will be hepend in that way. Numbers are as I see them and no one can garanty for them. I am looking for 211.60--, and 117.13++. patience! patience! and one more time patience! tx Karmo. I learn a lot from you!
Auslanco - GBP/JPY and GBP/USD (newstrade)
- Val144 replied Jan 21, 2008
Long perspective maybe - middle or end of march 2008. Next major support on Weekly is @50% FIBO, GJ - @200.07, GU - @1.9104 & @ 100% FIBO, UJ - @101.68. After that lvs. the weekly up trend for GU & GJ will be over.
Auslanco - GBP/JPY and GBP/USD (newstrade)