- Search Forex Factory
- 52 Results (1 Thread , 51 Replies )
-
 Tommy_C replied May 31, 2010
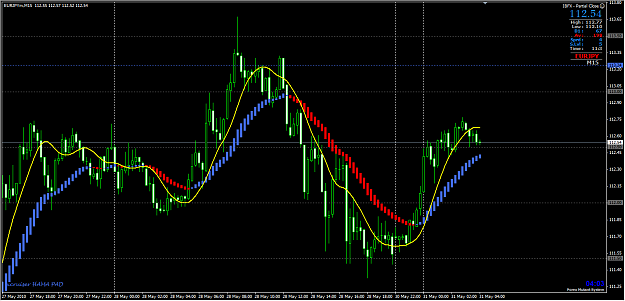
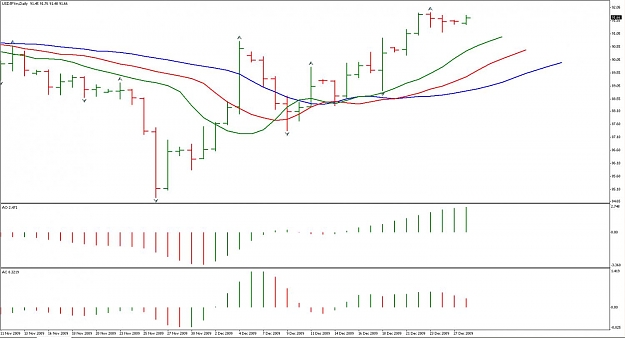
possible upcoming short — Well, I missed the earliest entry opportunity into the EJ long, but it looks like it might be setting up for a short in the near future....
Owl Main System
- Tommy_C replied May 30, 2010
1st trade — As I was away from the computer, I missed the first long entry of the night on the EUR/JPY. So I entered on a long break of the pullback candle. I entered at 112.49, and have TPs set at +25, +75, and +125. SL will move to BE+1 at ...
Owl Main System
- Tommy_C replied May 28, 2010
2nd trade — This next trade I actually entered a little early, but I felt the confluence of events justified it. First, price had come back down to the 50% fib level of the massive move up from yesterday. This fib level also coincided with the ...
Craig Harris Stochastics Method
- Tommy_C replied May 28, 2010
GBPUSD 28 MAY 2010 — Hello everyone, I know I am coming to this thread rather late, but I have been reading through as much as I can. I think I am only about 60% through it, so far. Still, I wanted to post a chart of a GBPUSD trade I took at ...
Craig Harris Stochastics Method
- Tommy_C replied Dec 31, 2009
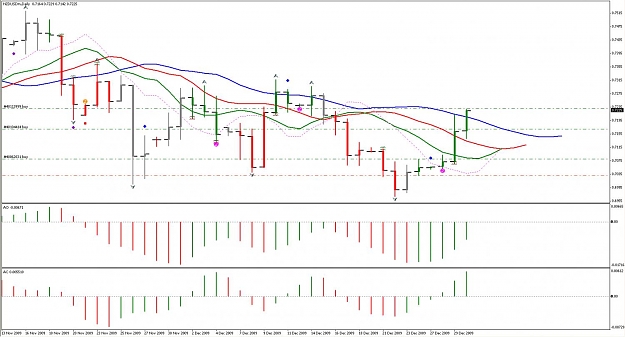
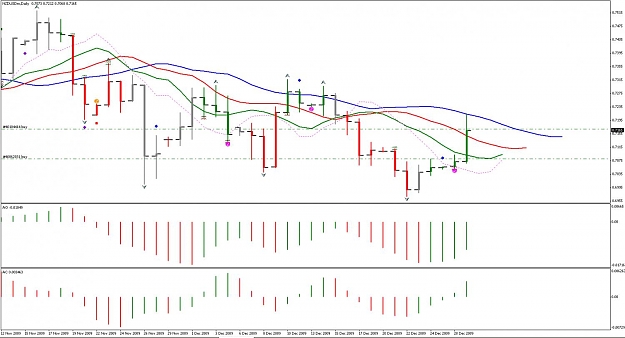
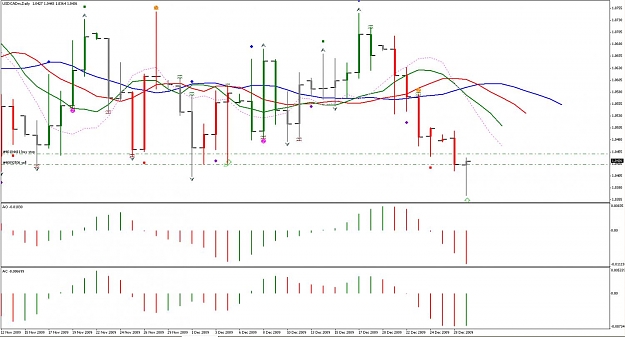
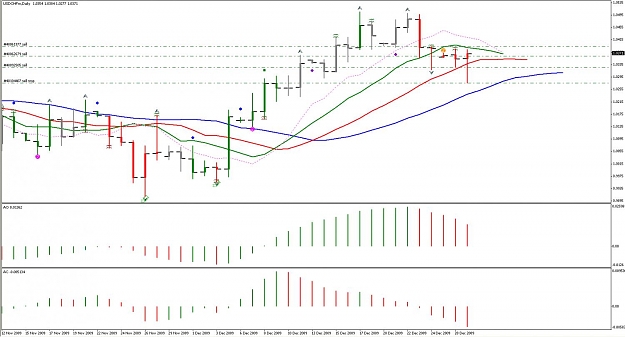
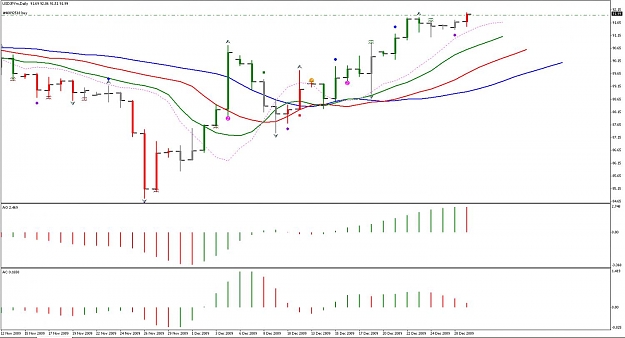
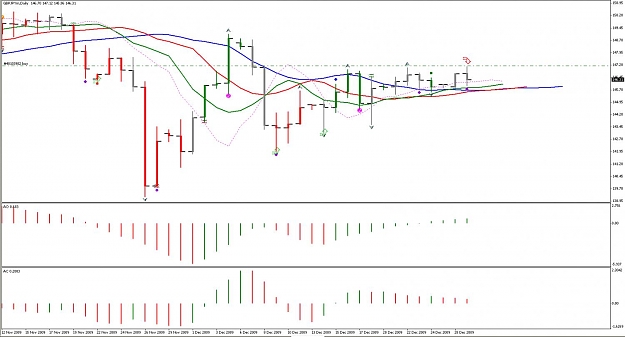
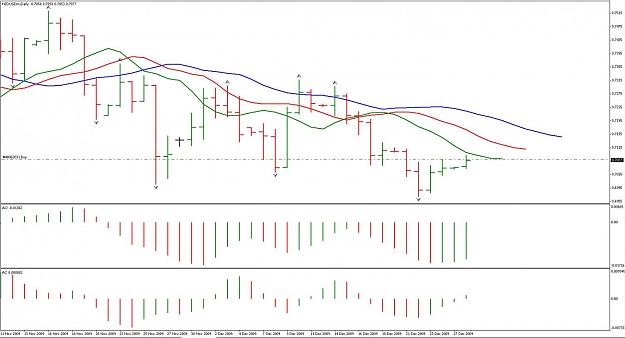
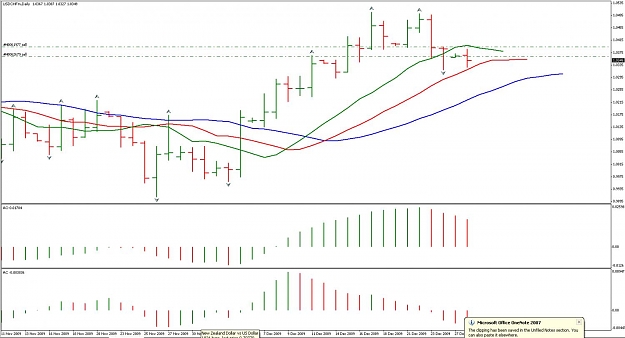
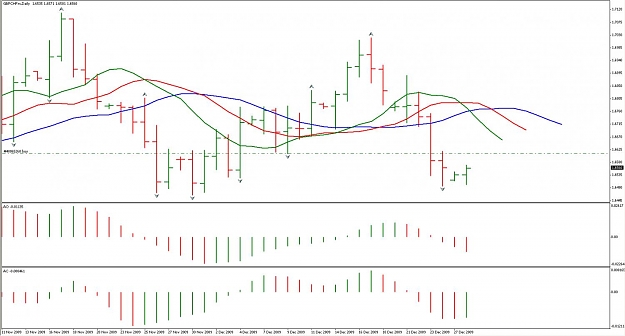
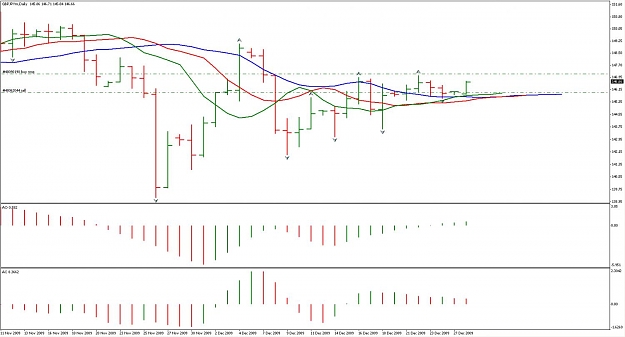
30 December 2009 Charts (cont.) — Here are the last four: NZD/USD: Price closed up. AO & AC were both green, too, so that is a classic ZT signal. I went long at the close of the current bar. There will, however, be no more ZTs taken on this ...
Trading Chaos Journal
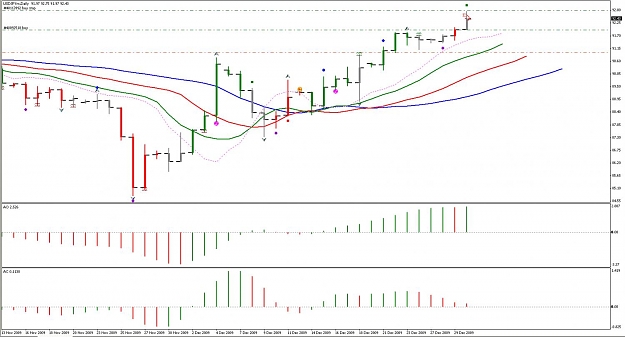
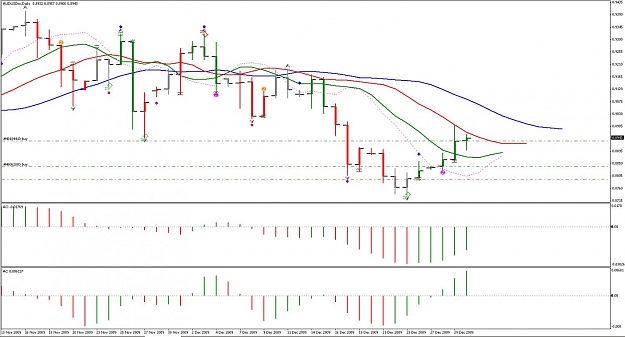
- Tommy_C replied Dec 31, 2009
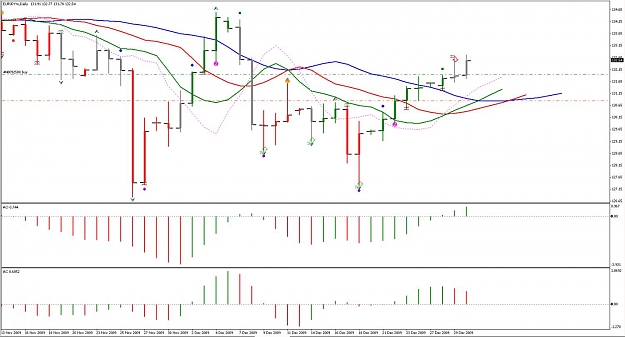
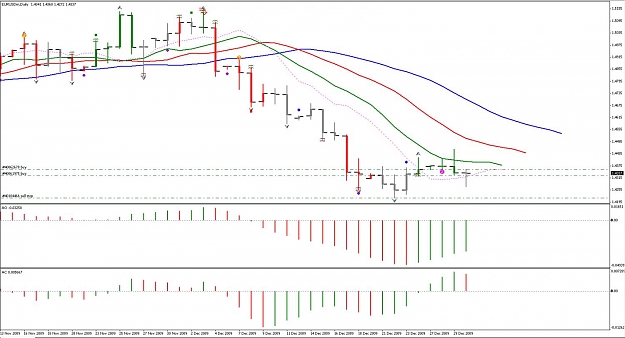
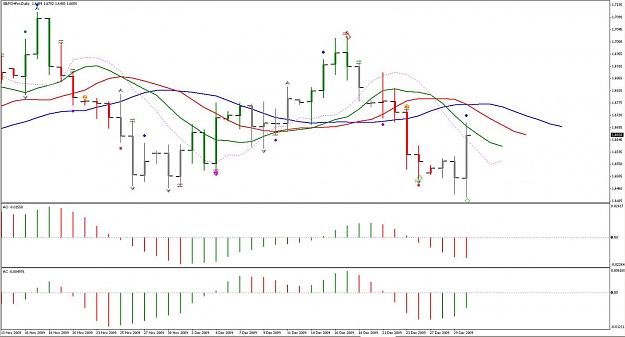
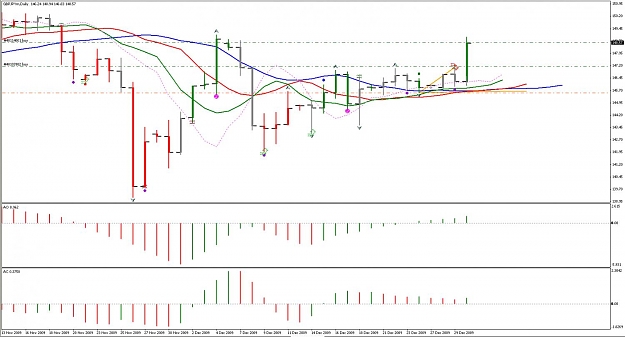
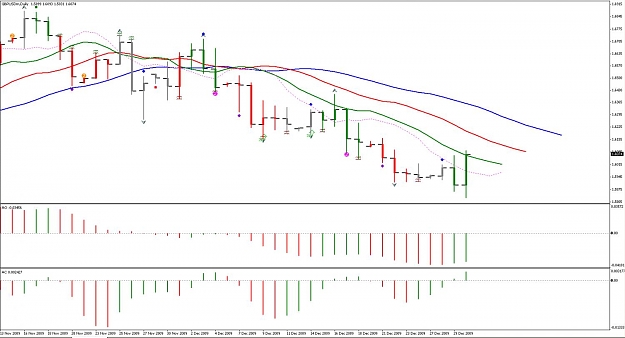
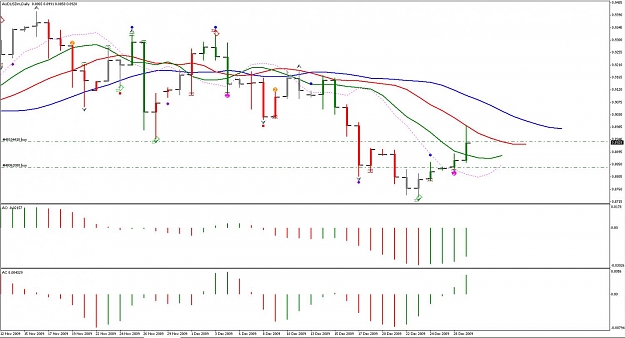
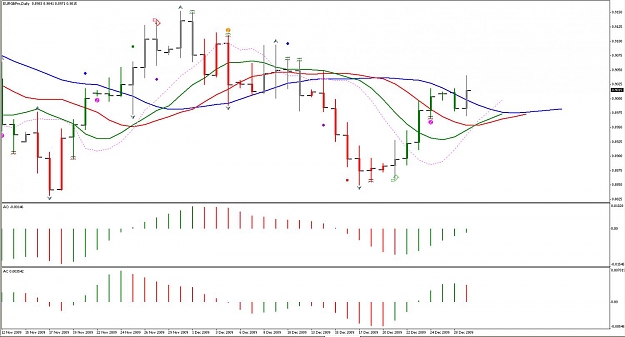
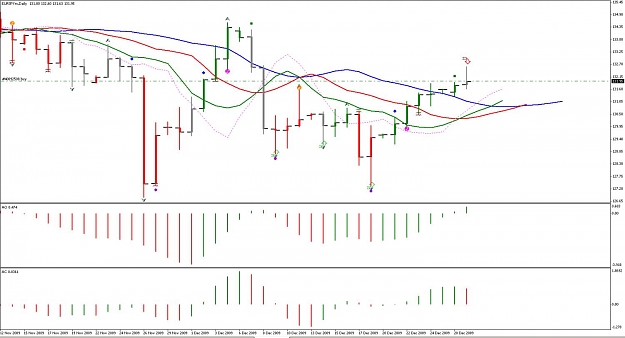
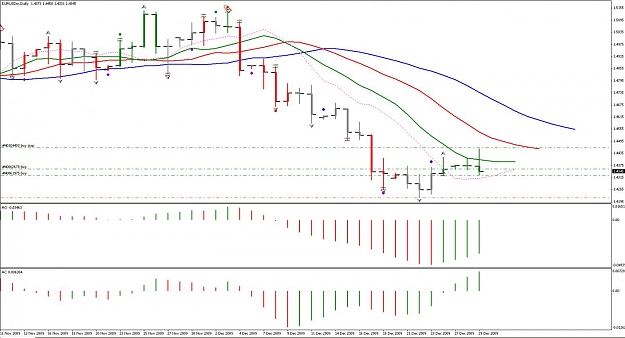
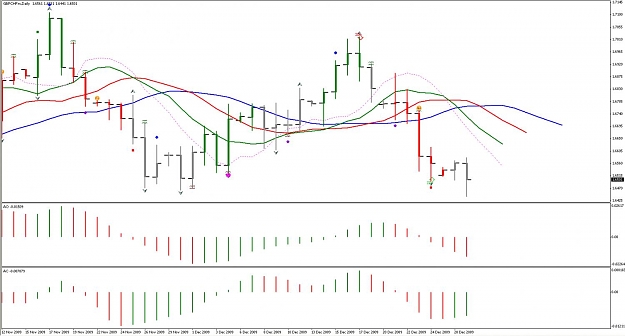
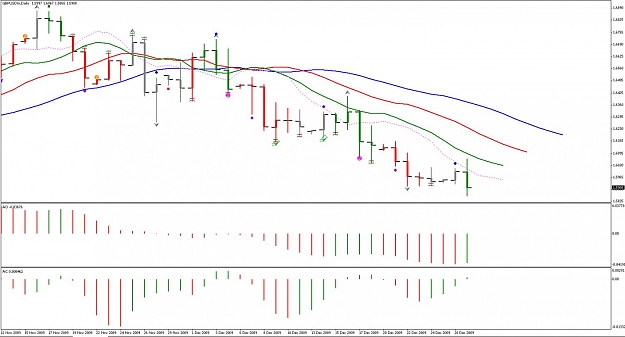
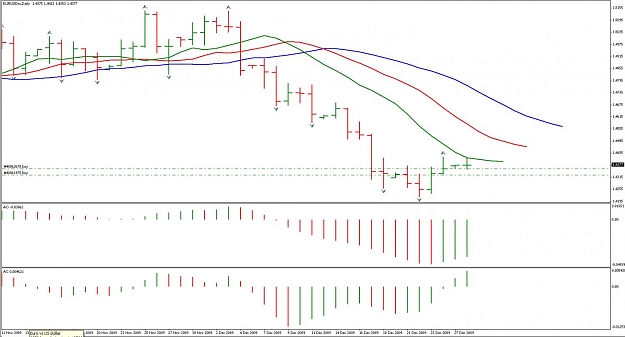
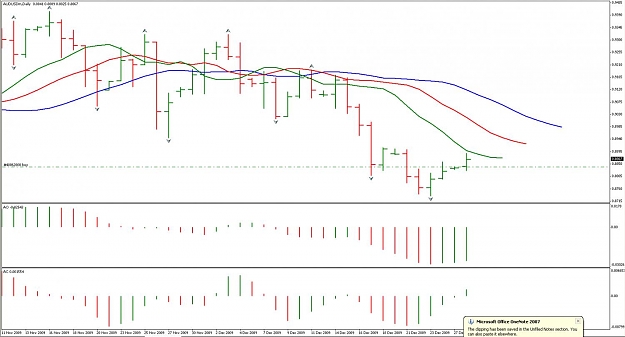
30 December 2009 Charts — Here are the first seven Daily charts from last night: AUD/USD: Both AO & AC were green, and price closed up for the day, giving a Zone Trade signal. Also, you could say that, as the high of the day before was higher ...
Trading Chaos Journal
- Tommy_C replied Dec 30, 2009
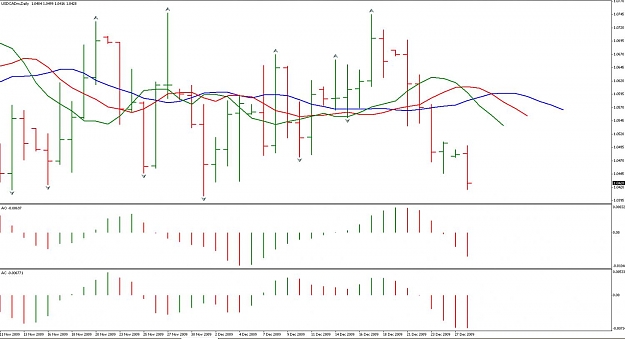
remaining charts for 29DEC2009 — Here are the last charts from last night: NZD/USD: There was a new signal today. With the strong up move, AO & AC were green and price closed up. That's a perfect Zone Trade signal, so I went long at the close ...
Trading Chaos Journal
- Tommy_C replied Dec 30, 2009
Charts for 29DEC2009 — AUD/USD: Discounting the Sunday bar, there were three green AO bars. Moreover, both AO & AC were green and price closed up for the day, giving a Zone Trade signal. I placed an order to buy at the close of the candle. ...
Trading Chaos Journal
- Tommy_C replied Dec 30, 2009
Remaining charts from 28DEC — Here are the others from 28DEC2009. NZD/USD: The current order is a hold-over from last week. There aren't any current signals on the D1. Actually, again, I should have a pending sell order below the recent down ...
Trading Chaos Journal
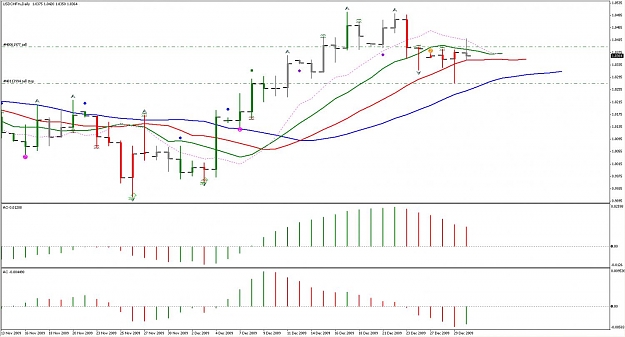
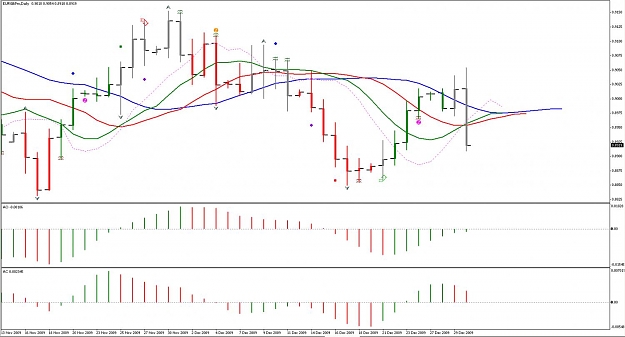
- Tommy_C replied Dec 30, 2009
Charts from 28DEC2009 — Apparently, I can't place images in the body of the post, so I will have to put them as attachments. Moreover, I can only put seven attachments per post. That's inconvenient, to say the least. Sorry.... Here are the ...
Trading Chaos Journal
- Tommy_C replied Dec 18, 2009
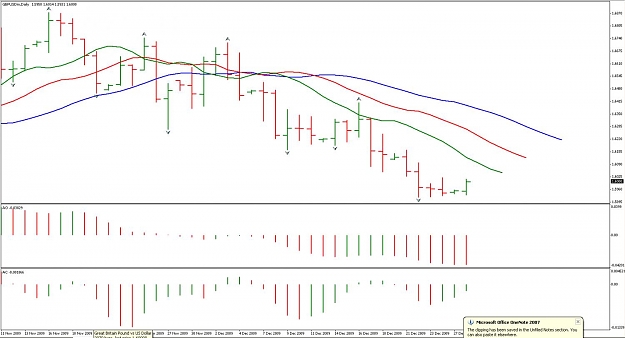
GBPUSD analysis — Continuing along with my trying to learn how to count the waves using the AO (or EWO), I have posted two GBPUSD charts. The first chart is the H4. W3 was easy to locate (highest or lowest peak in the last 150 bars). ...
Chaos Trading System
- Tommy_C replied Dec 18, 2009
Internal wave counts of H4 Wave 5 — I decided to drill down to the H1 and M15 in order to find out where we currently are in the H4 Wave 5. On the attached H1 chart, you can see that the wave count looks a little jacked up. Again, I identified ...
Chaos Trading System
- Tommy_C replied Dec 18, 2009
Trying to understand how to count waves... — I know that I am coming to this thread kind of late, and it has sort of died out, but I am hoping to revive it. I have Bill Williams' second and third books (New Trading Dimensions and Trading Chaos ...
Chaos Trading System
- Tommy_C replied Nov 30, 2009
GBPCHF Trade — Hello, everyone... I've used Ichimoku on and off for several years now. I have been away from Forex Factory for several months, and I was very surprised to see such an active Ichimoku thread upon my return. I have been wanting ...
Ichimoku forever
- Tommy_C replied Oct 25, 2008
Bull, I only have one small comment about the chart you posted. Williams, in his books, states that it doesn't matter where a fractal is formed, only where it is triggered. With that in mind, I have circled the last valid down fractal according to ...
Chaos Trading System
- Tommy_C replied Oct 21, 2008
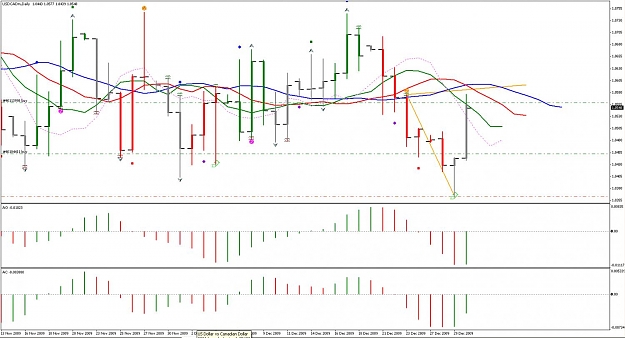
USDCAD entries — Starkovsky, I took your USDCAD chart and put in the entries that Williams would take, now, to show you how much earlier you could get into the trade. I put an arrow pointing to the Bullish Divergent Bar. Your first entry, at ...
Chaos Trading System
- Tommy_C replied Oct 20, 2008
Revised Entries — Hey, I have taken your image showing your short fractal entry and have added where Bill Williams, according to his most recent book, would have taken his trades and put his exits. In order to get the most out of the Chaos ...
Chaos Trading System
- Tommy_C replied Sep 14, 2008
GBP/USD Analysis — Hey everyone, So the GBP/USD started a retracement on Friday. I thought that I would post some charts analyzing what it might do from here. First I posted an hourly chart. From it you can see that price started at a low of ...
New Mouteki Method...
- Tommy_C replied Sep 9, 2008
NZDUSD — As we are all anticipating Mouteki's video on the NZDUSD, I thought I'd try my hand at analyzing it... I have attached a Daily chart. The NZDUSD has been in a downtrend since mid-March. I know that the chart looks like a mess, but ...
New Mouteki Method...
- Tommy_C replied Sep 5, 2008
GBP/USD analysis — Hey everyone, I've really been captivated by what Mouteki has shown us so far. I have always loved using fibonacci retracements and expansions, but these fibonacci zones have added a new dimension. I know he hasn't told us ...
New Mouteki Method...