- Search Forex Factory
- 30 Results (1 Thread , 29 Replies )
- Tilf replied Dec 14, 2013
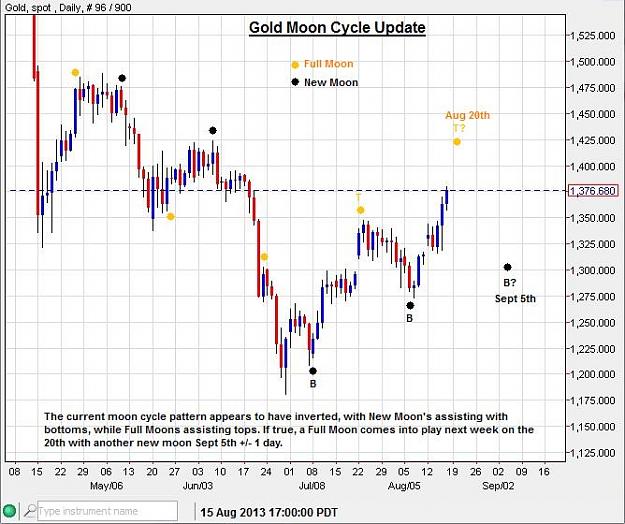
Here is the importance of moon cycle and its effectiveness. Second chart is an old one. These charts are not mine, and is picked up from free section of a subscription site (link not provided to the site as I do not want to advertise it). Obviously, ...
XAU/USD & XAG/USD - Gold & Silver Traders Thread

- Tilf replied Dec 6, 2013
Here is another one, not sure if Rhodie has posted before. Need your comments Rhodie. According to this one, critical moment will be mix next week, when price slips out of this ellipse. Also, if we are to move out, then Gold will not sustain under ...
XAU/USD & XAG/USD - Gold & Silver Traders Thread
- Tilf replied Dec 6, 2013
What say about the following chart Rhodie? Full marks on my geometry or not?
XAU/USD & XAG/USD - Gold & Silver Traders Thread Based on this pattern we should have a breakout as soon as today and as latest as Monday. For now, downside could be limited to 1212-1218 area while upside capped ...
- Tilf replied Dec 4, 2013
Yup, my buy position just kicked the hell out of Gold, and it just FLEW! Oh well, happens once in a decade with me. Why am I getting the money now? It's useless! Lol jk. What next? Put the market maker hat on. Do you really think they will let you ...
Love Lost

- Tilf replied Oct 16, 2013
My volume analysis. Hope this stuff helps anyone. Sorry to hijack your thread bantro!! It is the 15 min EURUSD spot chart for the day ..... Candle 1: Bull candle, Green volume(higher than previous) after a steady consolidation. Indicates buyers are ...
Timing the Trade
- Tilf replied Oct 16, 2013
Took the Euro short today, almost to the pip entry. Also took a Gold long 1272.50 and closed at 1282.50 (that's about 100 pips I suppose). Here is the Euro chart.
Timing the Trade
- Tilf replied Oct 15, 2013
Lot of confluence lining up for the EURUSD (Spot). Area of interest for me is illustrated on the chart.
Timing the Trade
- Tilf replied Oct 12, 2013
Here's the chart showing what I am asking. The black boxes are where you drew the supply. Would it be wrong the way I drew it? I have seen sam seiden's video and the whole rocky's thread. I think they concentrated more on the origin of a move. Do ...
Timing the Trade
- Tilf replied Oct 9, 2013
Bantro1, If you would allow me, I shall like to post a chart on Gold (this is spot Gold not futures). Do you think my analysis or thinking is kind of aligned with what rocky was teaching? Would be great if you could give your comments on it. I had a ...
Timing the Trade
- Tilf replied Sep 28, 2011
Missed out on some good EurUsd trade as I cannot watch markets for short term trades. No longer term trades right now. Short term pattern developed in US30 but I missed out on the entry as usual. The TP would have been hit had I entered (illustrated ...
VIX - Ride the profits
- Tilf replied Sep 27, 2011
Seems like trade is going good enough thus far. Approaching supply zone at the moment and may look to give an early exit for 0.9%-1% gain.
VIX - Ride the profits
- Tilf replied Sep 26, 2011
Thanks soho for the upload. Taking the trade in demo account according to the indicator. I was away so I missed out on the entry but I have set the limits, just in case the price gets back there. Risking 1% of the account for a 1% gain. Since the ...
VIX - Ride the profits
- Tilf replied Sep 24, 2011
Here is a SHORT TERM 1 HOUR chart. The profit factor will be less because it is short term and it may be harder to read charts. Trade number 1: No trade because when VIX fell sharply, the candle stick had large wicks on the both sides and the body ...
VIX - Ride the profits
- VIX - Ride the profitsStarted Sep 23, 2011|Trading Systems|22 replies
Hello to all FF readers, Let me introduce myself first before starting with the system. I am a ...
- Tilf replied Sep 23, 2011
Hey guys, I found something worth looking at. I have not used it yet for my longer term trades but it is really something to watch out for. I hope you guys have heard about VIX. If not, then don't worry as I myself do not have much knowledge about ...
XAU/USD & XAG/USD - Gold & Silver Traders Thread
- Tilf replied Sep 21, 2011
My fondness for line charts continue lol. Candle sticks on the daily look really ugly at the moment. A clear pennant formation is detected on the daily line chart. We had a false break earlier yesterday but with very low volumes. Usually I would ...
XAU/USD & XAG/USD - Gold & Silver Traders Thread

- Tilf replied Sep 17, 2011
Thanks for the reply. Is it steve's thread about which you were telling me? I just opened my platform and I found I had downloaded this indicator named : #MurreyMathLines_ShowHistory It has all the levels similar to you..is the same one? I have ...
XAU/USD & XAG/USD - Gold & Silver Traders Thread
- Tilf replied Aug 11, 2011
Here is the chart beeb. Ultra short term we have some sort of expanding pattern (not too strong to me). Overall the pennant lines will form short term term supports. Margin hike of 22% would mean that speculators lose 22% purchasing power on gold ...
XAU/USD & XAG/USD - Gold & Silver Traders Thread

- Tilf replied Aug 10, 2011
Going long here in small qty. Stop at 1740. Target 1810.
XAU/USD & XAG/USD - Gold & Silver Traders Thread
