- Search Forex Factory
- 23 Results (1 Thread , 22 Replies )
-
 Taters replied Oct 5, 2011
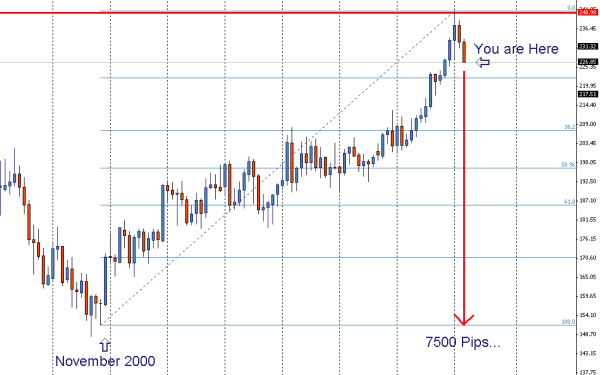
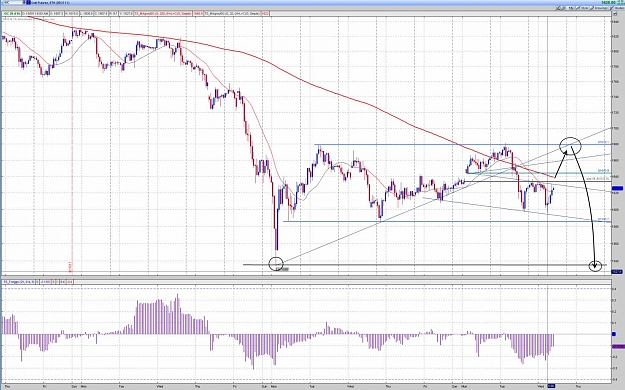
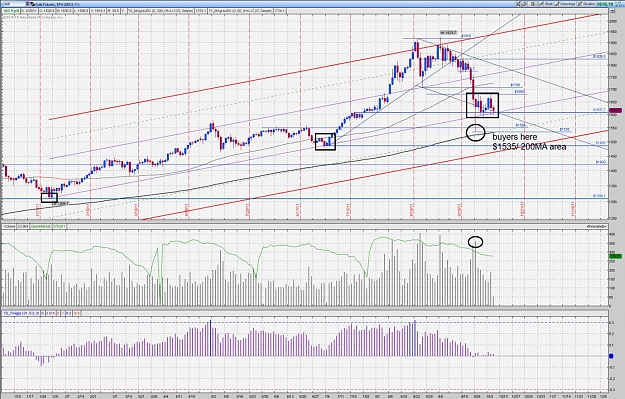
Gold Futures hourly chart — One way a retest of 1535 could play out could play out : retest of the channel top/ trend line, then drop through the lower support range to retest 1535 for a potential buy til the end of the year. See my post above ...
XAU/USD & XAG/USD - Gold & Silver Traders Thread
- Taters replied Oct 5, 2011
Gold Futures chart — Looks like it will roll over to find some demand @ 1535 area. I think many people who got burned are on the sidelines at the moment. That said though price is at the bottom of a channel / trend line is has been climbing ...
XAU/USD & XAG/USD - Gold & Silver Traders Thread
- Taters replied Sep 26, 2011
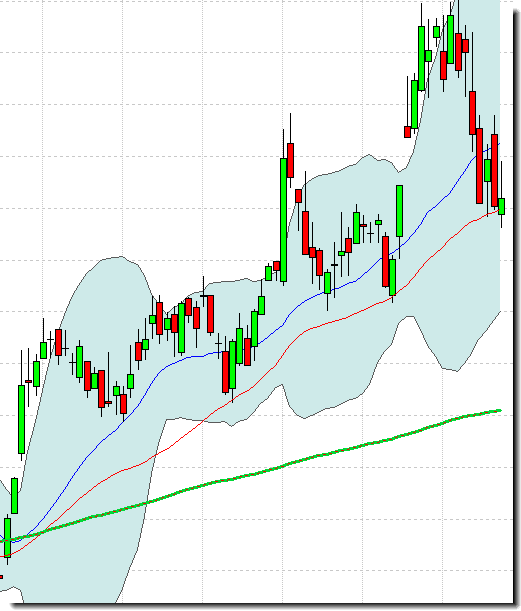
DPO — Short explanation: the zero line represents the moving average and price swings are shown above / below.It's an unbounded oscillator, meaning it does not swing relative to +-100. In an attempt to quantify how much of a swing is ...
MT4 Indi request: DPO w/Keltners
- Taters replied Jan 10, 2011
Taters mark-up of pippete's chart — Hey all- I'm done for the day so I thought I'd mark up a chart. Seems like some folks on this thread are really nailing it! Please forgive the crazy color scheme- it was part of a grand design but got out of ...
Trade What You See - Almost Naked Trading
- Taters replied Dec 8, 2010
Taters mark-up — hope you don't mind Taters $.02. You obviously see whats happening but just for fun I thought I'd annotate my thoughts... Cheers, T image
Trade What You See - Almost Naked Trading
- Taters replied Aug 1, 2007
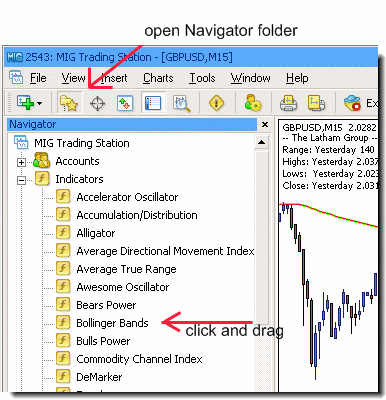
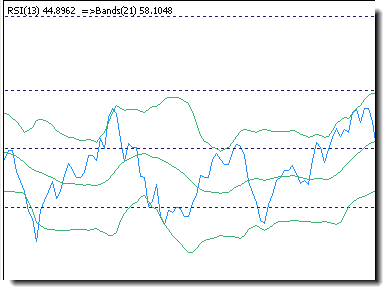
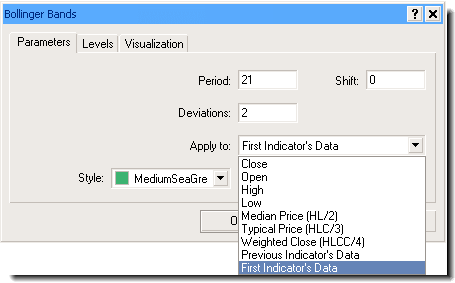
You're lucky I'm procrastinating today — 1. Open the Navigator folder, then click, drag, and drop your desired indicator onto the other indicator. 2. In the parameters tab select "First Indicator's Data" 3. Voila. This should be a Sticky... ...
MT4 question
- opaque bollinger bandsStarted Aug 1, 2007|Platform Tech|0 replies

does metatrader have the capability (custom of course) to draw Bollingers or other non-rectilinear ...
- Taters replied Aug 1, 2007
not makin money ... —
Cable Update (GBPUSD) but I made a purty chart.
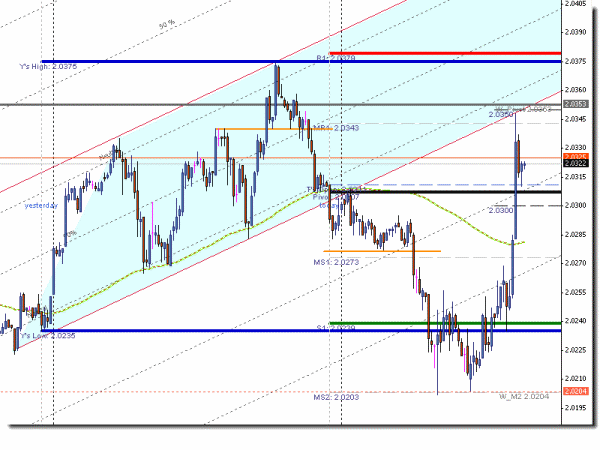
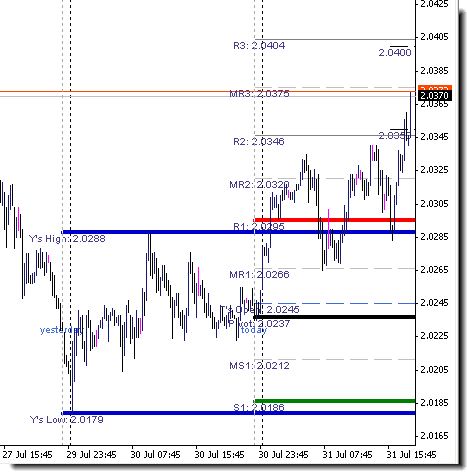
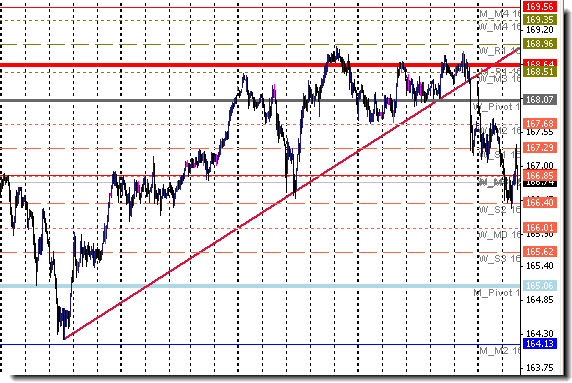
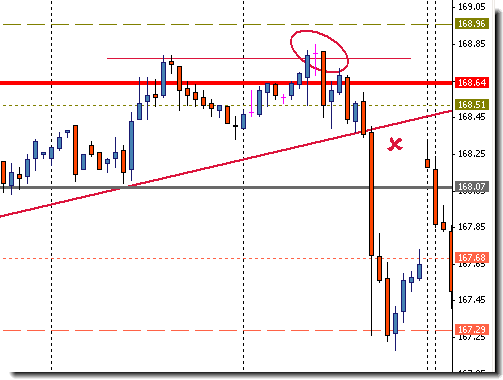
 Really just wanted to point out classic TA of retouch of breakout channel. Textbook stuff. How do they get those moves spot-on? To the pip! image
- Taters replied Jul 31, 2007
oops- sent the wrong file- — Here is the .mq4. I have modded many versions of this Shimodax's classic indicator. Hi Low Open & "Sweet Spots" makes a really nice clean indicator. Here is my personalized Taters version ("9SR"): P, S1/ R1 in ...
HELP! Simple Indicator: Place horizontal line on hi and lo of prev. day
- Taters replied Jul 30, 2007
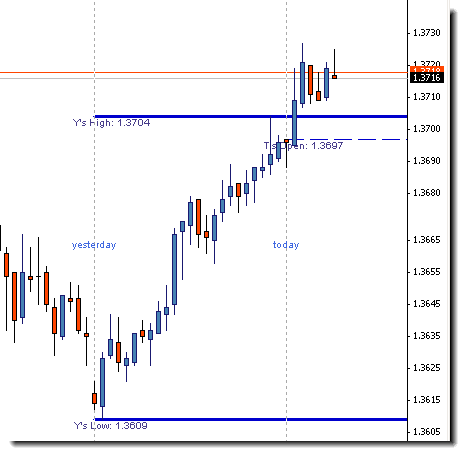
ok try this — Set everything to "False" except "hi-lo-open". Adjustable time zone too! Cheers, Taters image
HELP! Simple Indicator: Place horizontal line on hi and lo of prev. day
- Taters replied Jul 24, 2007
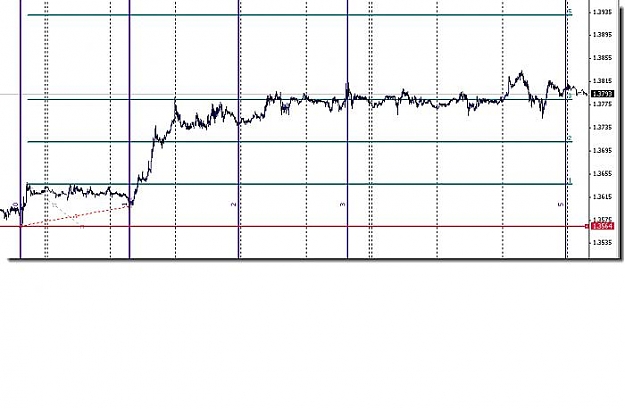
Trendline break — Price lost momentum at the monthly pivot and broke through a big trend line. Doji on the one hour chart. Pure price action- no indicators necessary. I was on a bus at the time. Now I'll HAVE to get Metatrader Mobile!
Daily EUR/JPY analysis ...
...
- Taters replied Jul 19, 2007
Coulda woulda shoulda — I'm eventually looking for price to hit the far side of the channel seen in a prev post, but I could have paid attention and reversed at the doji or "hedged" for a small profit... hopefully we will see a bounce at the ...
Daily EUR/JPY analysis
- Taters replied Jul 19, 2007
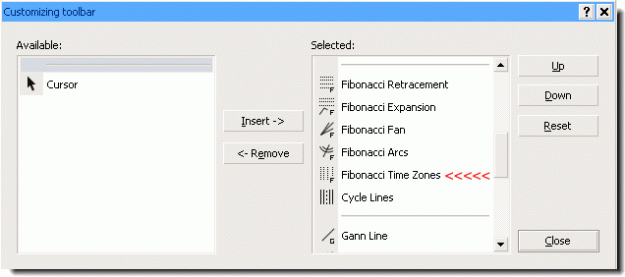
Fibonacci time zones — I thought you wanted your time zones to read vertical but you want your fib numbers to read horizontally. OK it's possible. There is a tool called Fibonacci Time zones. If you don't see the little "F" with vertical lines ...
Pointer in the right direction please-Guide to fib mapping!
- Taters replied Jul 19, 2007
Little known facts — ...about MT4: I see posts like this all the time. You can type almost anything in the parameters area of objects and MT4 will make it so. Just type in whatever numbers you wish for the regular fib price numbers like this ...
Pointer in the right direction please-Guide to fib mapping!

- Taters replied Jul 18, 2007
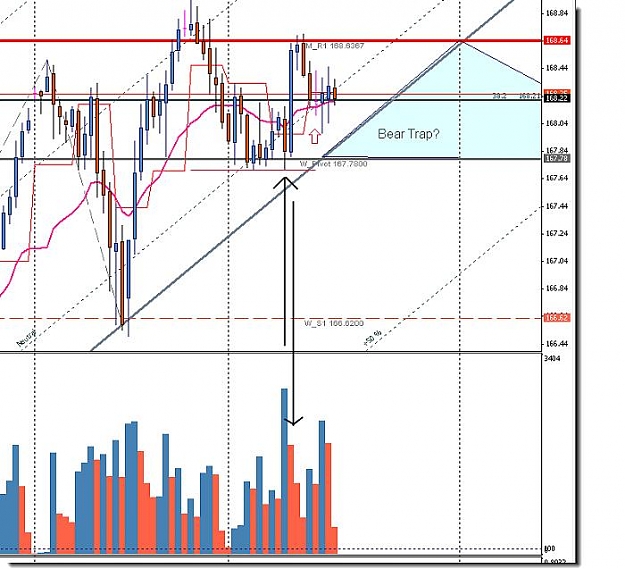
Volume — Interesting that the selling pressure was greater on the bar previous to the rally from WP->MR1 than the rally itself. Fewer buyers = falling prices. 4HR Macd is way rolling over too.
Daily EUR/JPY analysis
- Taters replied Jul 11, 2007
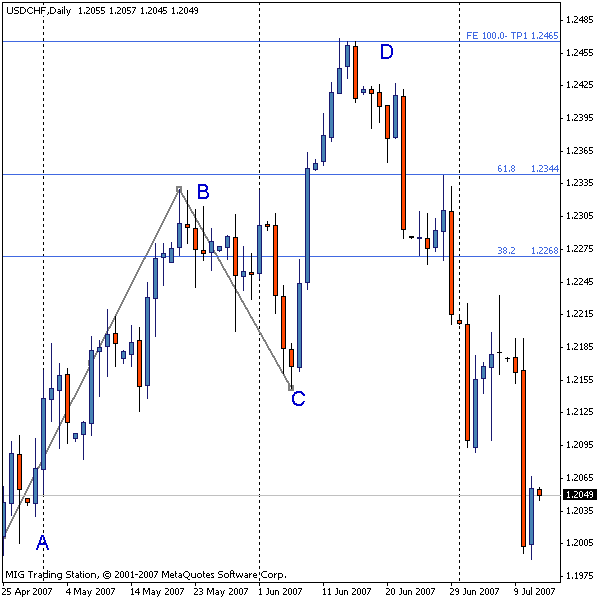
you may want to also check out the fib expansion tool — It works a bit differently in the way it projects price but it's worth a look.
Profit targets of FIBS
- Taters replied May 14, 2007
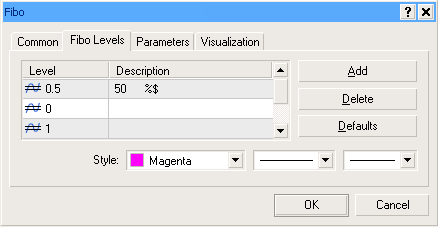
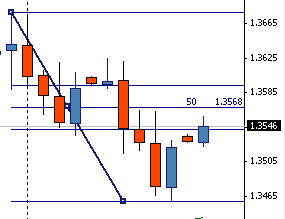
displaying price levels — I could not get either indicator (expert) to work, but here is a trick for displaying price levels: on the "description" line of the "levels" tab in the fib parameters window just type " %$ " (no quotes) on the line ...
Fibonacci Auto-Draw
- Taters replied Apr 4, 2007
click or double-click — ...on the expansion object to edit the end points. Or, go to Tools->Options->Objects and check the "Select Object after creation" box ,to default all objects to editable after you draw them. Hope this helps! Cheers, ...
Help with Fibonacci Expansion - 3rd Point?


- Taters replied Mar 7, 2007
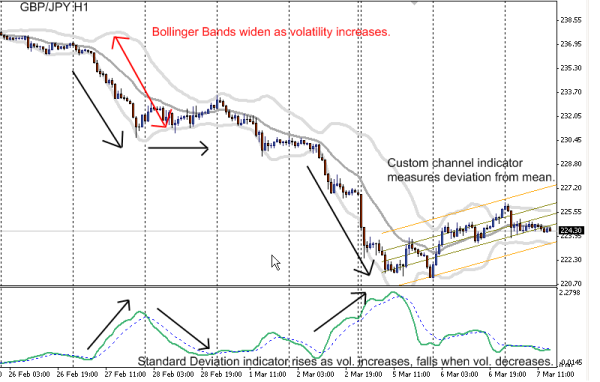
Some Standard Deviation indicators — Here is a chart I made showing some Standard Deviation indicators. For those who don't know, basically St Dev is a measure of volatility. ie: trend or flat- how much is your data deviating from past data. ...
Daily GBP/JPY analysis
- Taters replied Mar 2, 2007
I wonder what spooked the market in '98... Anyway we gots a loong way down to go if they really let go of the carries...
Daily GBP/JPY analysis