- Search Forex Factory
- 12 Results
-
 RickyRudy replied Oct 25, 2009
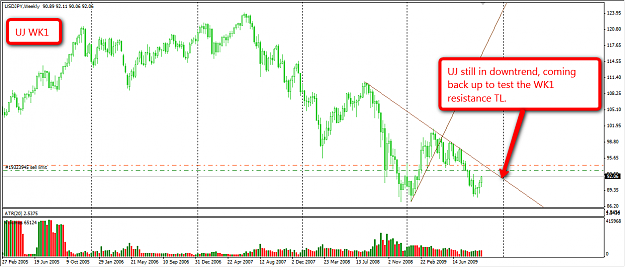
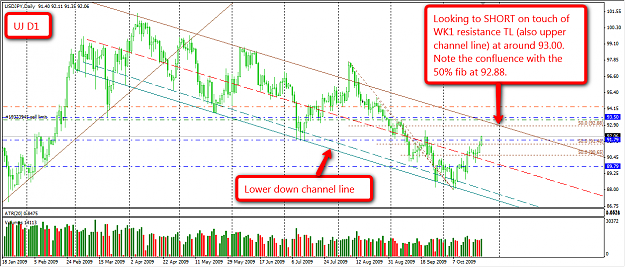
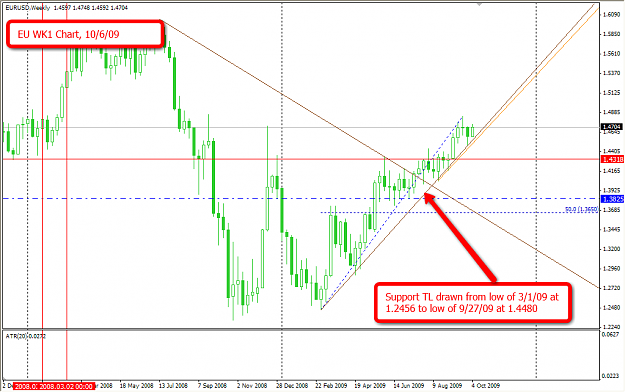
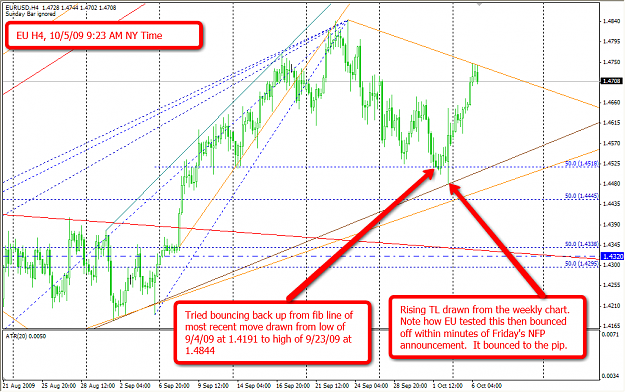
Castlerock, I realize you posted the question to Dan. Apparently, Dan is busy with his baby at the moment. If I may offer my observation. I'm presenting a Week 1 Chart and a Daily Chart to show you what I've been seeing for a few months. Start with ...
Trend Trading Chart Thread
- RickyRudy replied Oct 8, 2009
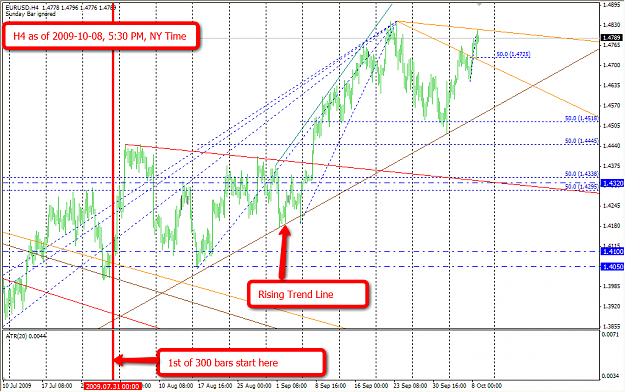
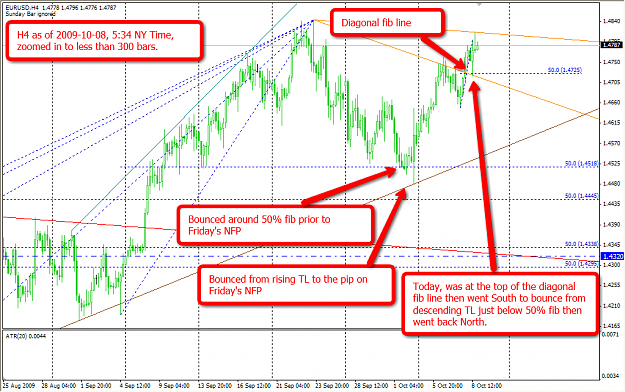
I've decided to post my charts. I'm thinking that perhaps some people might be confusing retracement with a trend. Feel free to correct me if you think this posts is out in left field. The first chart, titled "H4 as of 2009-10-08, 5:30 PM, NY Time," ...
Jacko's Forex House of Pleasure and Pain
- RickyRudy replied Oct 6, 2009
For those still considering an AH, I've attached the charts I mentioned in the post above as food for thought. Here is a detailed explanation of the charts: I’m providing the weekly because it gives greater perspective showing how the ascending ...
Jacko's Forex House of Pleasure and Pain
- RickyRudy replied Jun 18, 2009
It’s looking bleak for those of us waiting for 4000. Here is my 4H chart as of 8:25 NY AM, NY Time. The two dashed lines towards the bottom half of the chart show the triangle that had been forming as of around 3 days ago. The top part of the ...
Jacko's Forex House of Pleasure and Pain
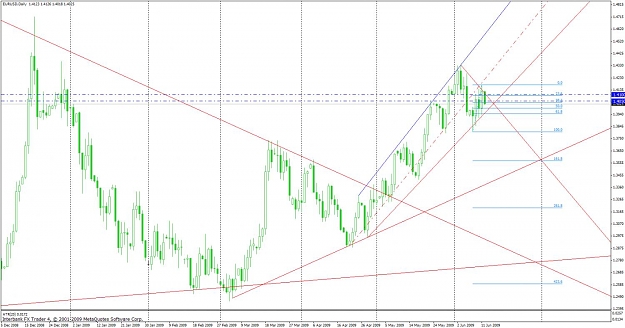
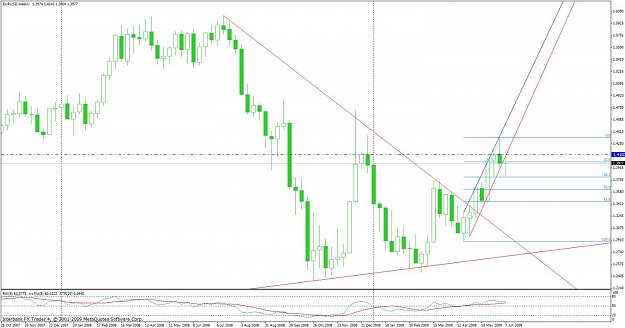
- RickyRudy replied Jun 12, 2009
Thanks Jpnek. As promised, I've posted an update to my previous chart. In fact, I've included 2 charts, a H4 chart and a daily chart. Both are as of 6:50 AM NY time or approx 10:50 GMT (if my conversion is correct). All the lines you see on both ...
Jacko's Forex House of Pleasure and Pain
- RickyRudy replied Jun 11, 2009
See the attached H4 chart. I closed out at 1.4095. It's since gone as high as 1.4111, but struggling. I've actually posted in Epilogue's journal as I am trading similar to his modified version of this method.
Jacko's Forex House of Pleasure and Pain
- RickyRudy replied Jun 10, 2009
This is in response to one of Low's post where he/she was waiting for EURUSD to get to 1.36. While I don't think it is likely, it is NOT far from out of the realm of possibility. Looking at my weekly chart I can imagine a 50% fib retracement to that ...
Jacko's Forex House of Pleasure and Pain
- RickyRudy replied May 22, 2009
lol, that was exactly the plan I crafted earlier today. I set the upper blue line in my chart early this am and was wondering if EUR would hit 1.4000. The damn thing hit the upper line right at 1.4000, shot past it, dropped below, retested and ...
Jacko's Forex House of Pleasure and Pain
- RickyRudy replied May 17, 2009
I am new to Jacko's Trading. I just finished drawing a Fib line on my closing chart for the past week. I don't know if this is where Jacko would draw his fib but mine is drawn from 1.3252 on May 7th to 1.3722 on May 13th. As my attached chart shows, ...
Jacko's Forex House of Pleasure and Pain
- RickyRudy replied Jun 19, 2008
Three Promising Setups — I've spotted 3 setups that seem promising. They are AUDUSD (long), NZDUSD (long) and CHFJPY (short). Once again you have to wait until close of candle for confirmation. Also keep in mind that AUD and NZD are highly ...
AshFX Daily
- RickyRudy replied Jun 19, 2008
USDCAD Trade Update - Today's Preliminary/Potential Setups — I’m typing this at around 9am EST. The first lot on my USDCAD sell trade from a couple days ago has hit take profit for 41 pips. The second lot is still running in the right ...
AshFX Daily
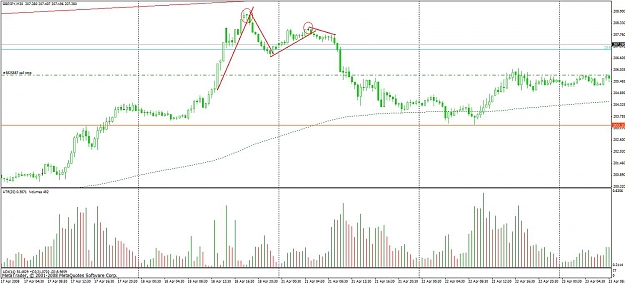
- RickyRudy replied Apr 27, 2008
Following up my previous post, I've attached a 30-min chart of EURUSD showing candles on April 18, 2008 and April 21, 2008. The first circle on the left shows a hanging man while the second shows a doji. I drew rough trendlines on the chart to show ...
Gamblers 5 and 15 minute trading system
- Posts by Member Search: 'RickyRudy'