- Search Forex Factory
- 25 Results
- Pkurdy replied Jun 17, 2011
Do not rush — 5M chart. is it 38.2% retr. FIB? Wait for confirmation
Cable Update (GBPUSD)
- Pkurdy replied Jun 17, 2011
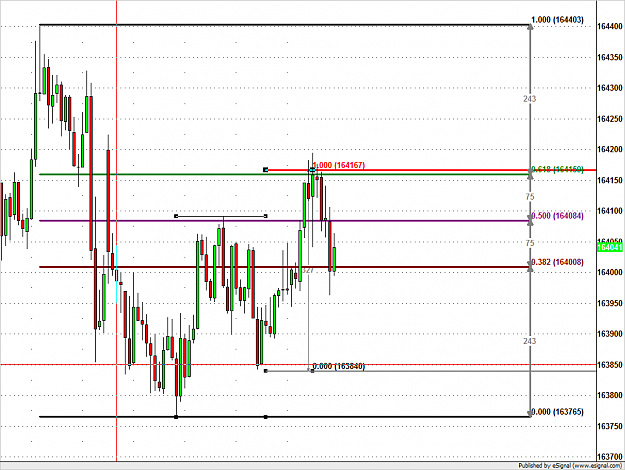
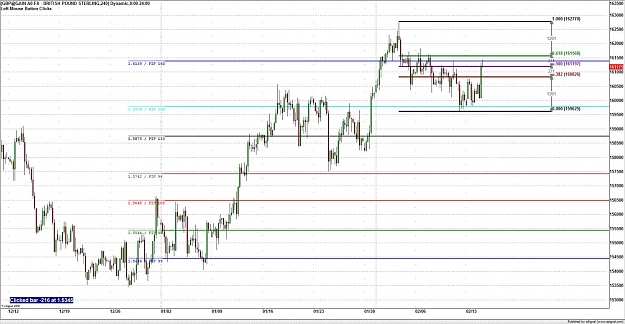
Announcement USD - Consumer Sentiment — If announcement brings price at 50% - 61.8 % FIB Retr., it'll be good long entry after confirming the support of FIB level. However breaking 1.619 will then unleash the bullish trend. GL
Cable Update (GBPUSD)
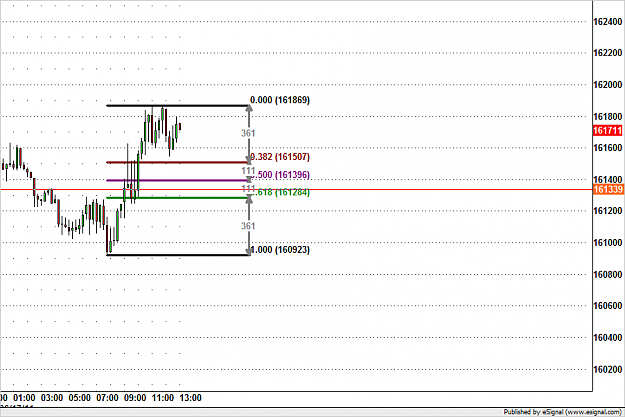
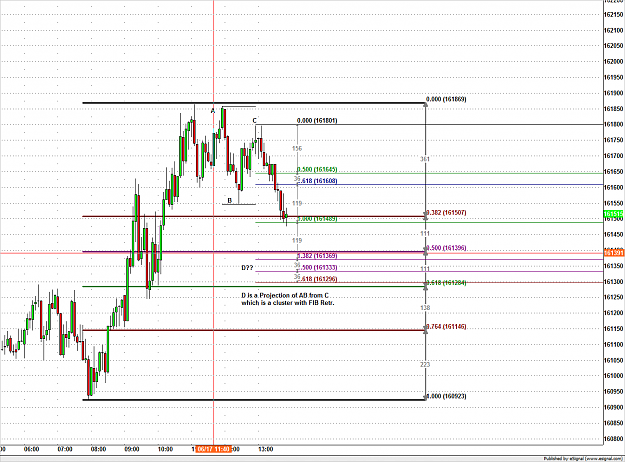
- Pkurdy replied Jun 17, 2011
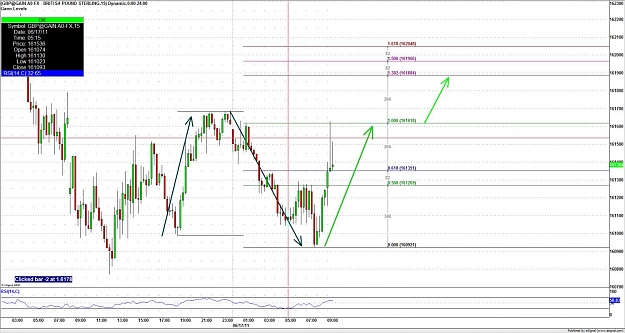
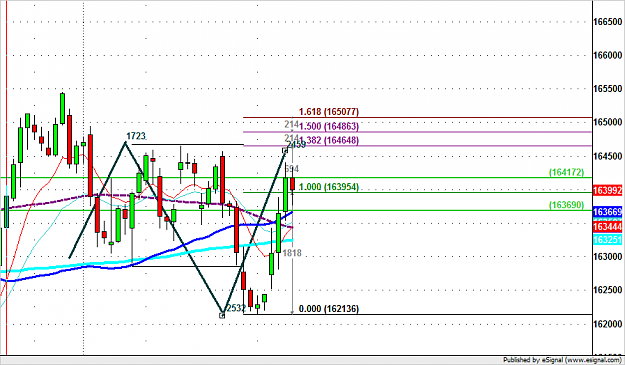
FIB extensions — The price has reacted forcelly at 100%, hoiwever that doesn't change anything. If it's bullish , then Price will hit easily the other extensions level as shown. GL
Cable Update (GBPUSD)
- Pkurdy replied Jun 17, 2011
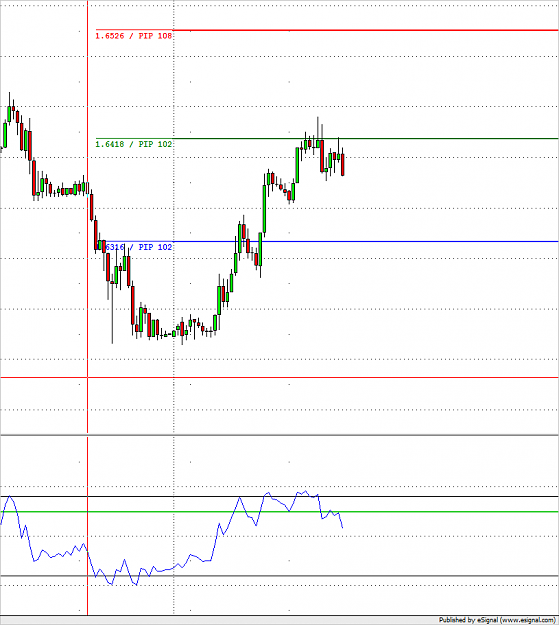
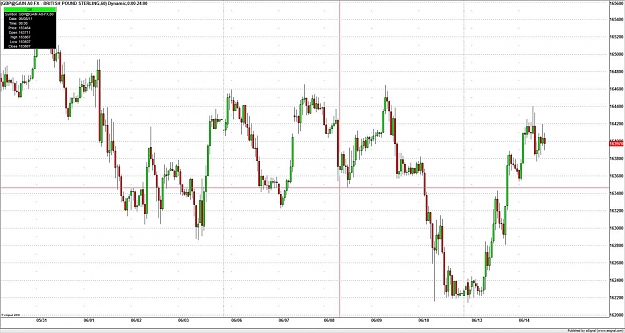
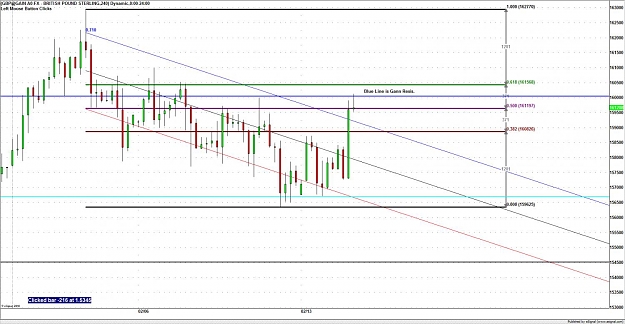
Hi, King Remember that below 1.61 we could not long and must be cautious. However targets of long as shown in Gann levels, 1.6180 - 1.6280. But prices may act at 38.2% , 50% and 61.8% FIB levels - retracements of the downtrend.
Cable Update (GBPUSD)
- Pkurdy replied Jun 17, 2011
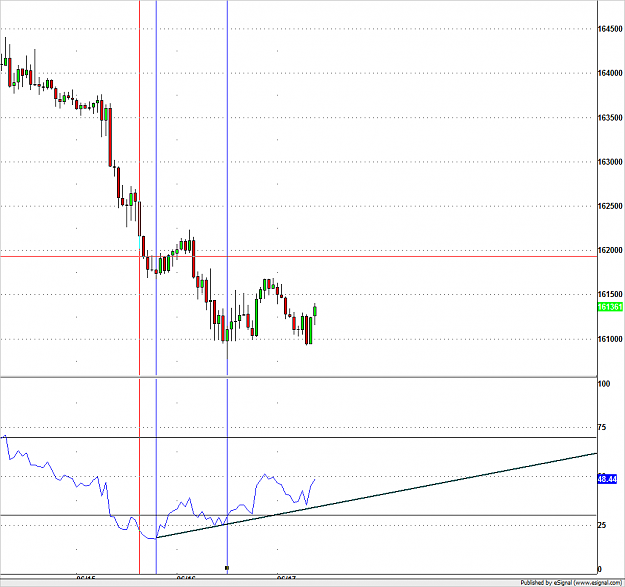
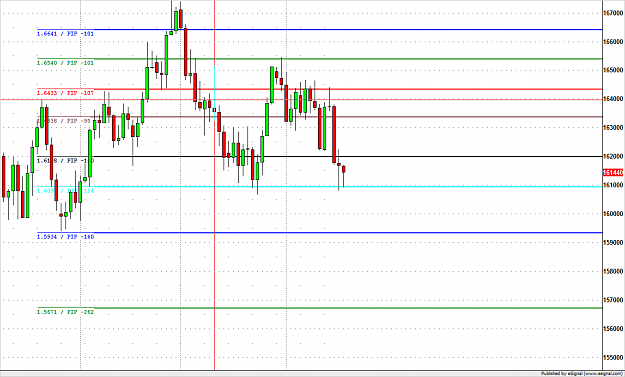
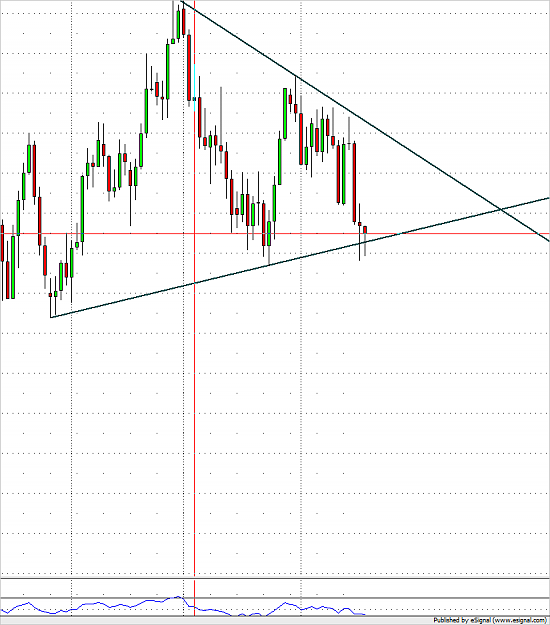
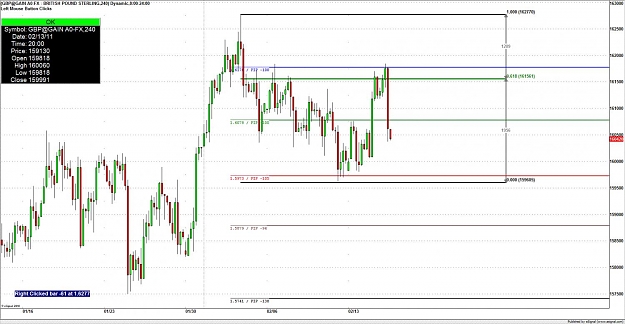
Demand Zone above 1.61 — Why 1.61 is a demand zone? First:- There is a divergence in the RSI(14) - 1H chart . Second:- Gann Level 1.61 in daily chart (cyan line). Third:- It closes above the trend line in daily chart, where a symtric triangle ...
Cable Update (GBPUSD)
- Pkurdy replied Jun 14, 2011
It is obvious that PA could not be close above Gann level of 1.6318 . And the RSI of 62.28 could not be breached above. So buyers still weak. GL
Cable Update (GBPUSD)
- Pkurdy replied Jun 14, 2011
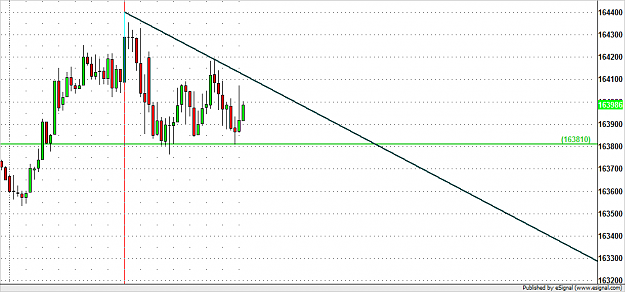
Descending Triangle in 15 M is formed, so trading the breach of 1.6380 support is logic. GL
Cable Update (GBPUSD)
- Pkurdy replied Jun 14, 2011
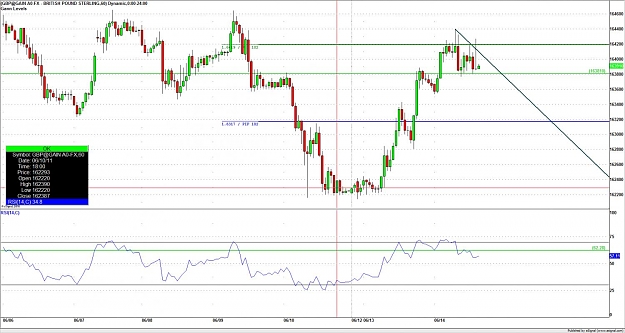
As you can see: First, that 1.6318 is a Gann resis. level and could not be breached above. Second look at the RSI, where the 62.28((Green Horiz. line) is breached and there weren't any bullish power. However after it was breached south it was ...
Cable Update (GBPUSD)
- Pkurdy replied Jun 14, 2011
1.6416 is a retracement of 61.8 FIB level and also FIB ext. 100% in a 5M time frame
Cable Update (GBPUSD)
- Pkurdy replied Jun 14, 2011
1.6395 is an important level. — As it fails for two hours to close below 1.6395. So consideration must be taken to be more careful especially that 1.6395 is 100% FIB ext. So if volatility is seen at time of USD session upward above this price ...
Cable Update (GBPUSD)
- Pkurdy replied Feb 16, 2011
Cluster of Gann Resis and Fib. — Hi Petar, What do you think about: Here we find cluster of Gann Resistance at 1.6178 along with FIB 61.8 from the same swing high of 1.6277. At this zone we find good short traders. G/L
The ART of trading by Petar_Serbia
- Pkurdy replied Feb 15, 2011
hi WengOn, Here is a zoom version of 4H chart. Good luck
Cable Update (GBPUSD)
- Pkurdy replied Feb 15, 2011
Cluster of Resistances — Cautious for long traders as we are at important levels of Resis. Near Fib 61.80 Resis. Horizontal blue line of Gann Resis. G/L
Cable Update (GBPUSD)
- Pkurdy replied Feb 14, 2011
Careful from Short entry at NY session — Be careful from short entry at NY session. G/L
Cable Update (GBPUSD)
- Pkurdy replied Feb 14, 2011
Appreciation for Help. — Thank you for your help. I see that your chart is may be 8 hours/ candle and its completely true but would you consider the following chart in weekly chart and note that the price was at R. Trendline & Horizontal R ...
Cable Update (GBPUSD)
- Pkurdy replied Feb 14, 2011
Bullish & Bearish Eng P. Candles in 30 min. — I agree totally with you but we should be cautious because we see Bullish engulfing price action at Support around 1.5980. However, we see another Bearish engulfing pattern with R at 1.6036, so ...
Cable Update (GBPUSD)
- Pkurdy replied Feb 14, 2011
Price action always wins over any TA — I respect pivots too but in our scenario as you see below, the daily and pivots mean nothing because of their continuous breakout. It is always price action which counts on whatever pivots S/R or any TA. ...
Cable Update (GBPUSD)
- Pkurdy replied Feb 14, 2011
I'm trying to catch an early entry. 1.6024 is near 4h support. G/L
Cable Update (GBPUSD)
- Pkurdy replied Feb 14, 2011
Short Entry Now — It's time to consider Short entry as we see: - Shooting Star in 60 M; - Bearish Engulfing Pattern in 15 and 45 Minutes candles. - For tight SL consider the entry below 1.6075 and SL 1.6090 TP 1.5980. - Alternative :- entry ...
Cable Update (GBPUSD)