- Search Forex Factory
- 8 Results
-
 PipAV8tor replied Mar 13, 2008
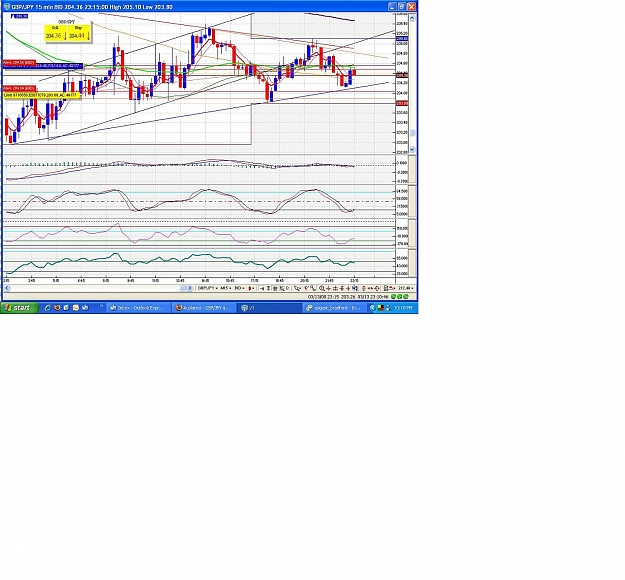
No — Just what I see. 15 min chart. Broke the channel. Retested the channel. Bounced off the 50 sma. Looks down for at least a little while. I have numbers in mind, but that is not important. Trade what you see. image if you can't view it or ...
Auslanco - GBP/JPY and GBP/USD (newstrade)
- PipAV8tor replied Jan 25, 2008
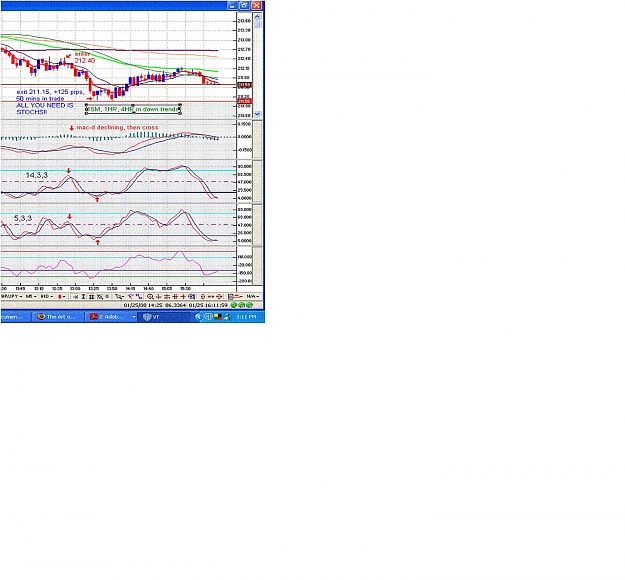
What has happened — All of the sudden, everyone is gone. Have we lost our faith in STOCHS?? Here is a trade I took earlier today. Very simple trade off of the 5 min chart. Larger time frames were in agreement. Primary indicator; the 14,3,3, ...
The Art of Trading with MTF Stochastics
- PipAV8tor replied Jan 8, 2008
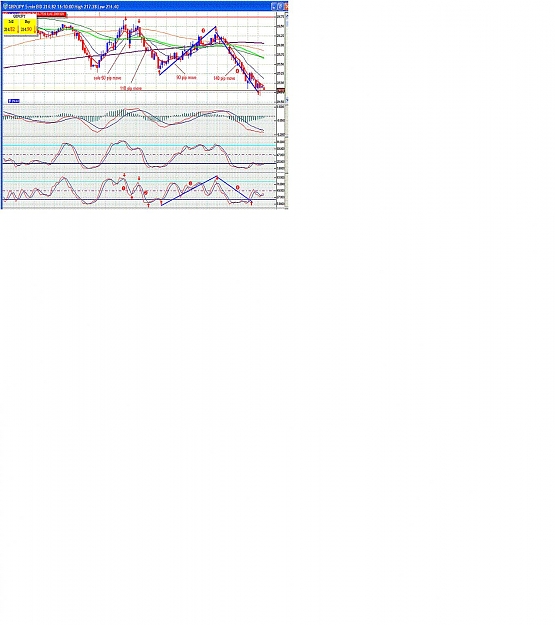
Finally a chart — If you want a better view, email me and I will send it to you. These moves are from today, approx 10 am EST to 4 pm EST on the 5 min chart. image sorry, it looks huge on my screen.
The Art of Trading with MTF Stochastics
- PipAV8tor replied Nov 28, 2007
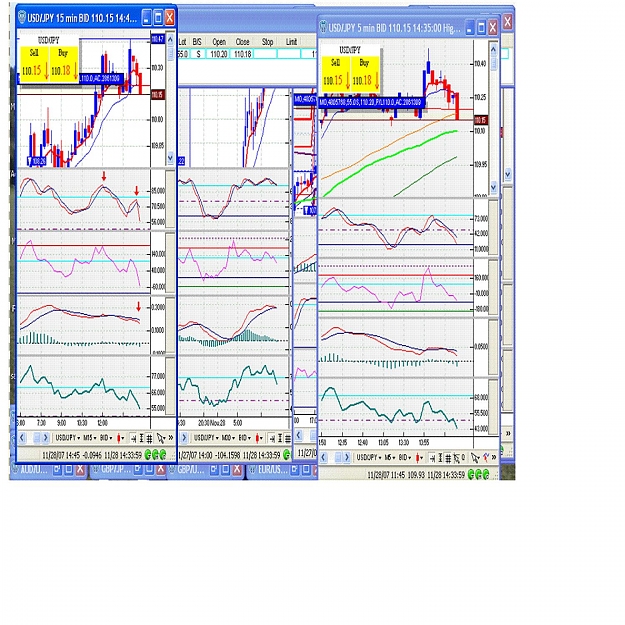
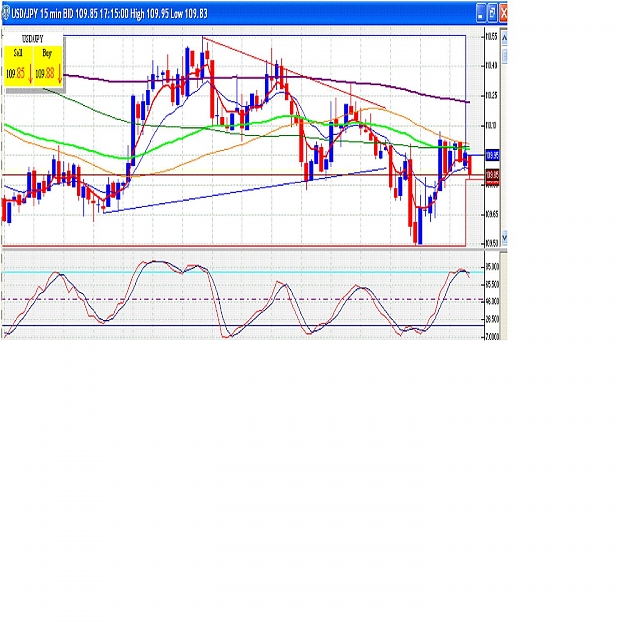
Chart — image Currently +13 pips w/ 5 locked in for profit. Looking to run down toward 109.65 if it breaks through at 110.00. +23 now with 10 locked in. One last update, price retraced and I got stopped out with my +10. I still think a move ...
The Art of Trading with MTF Stochastics
- PipAV8tor replied Nov 20, 2007
I not recommending... — Canuck, There is definitely volatility in that pair, anything with the yen, for that matter. I am just saying that it is trending down nicely with the stochs in line. It would take some major "good" news for the dollar ...
The Art of Trading with MTF Stochastics
- PipAV8tor replied Nov 19, 2007
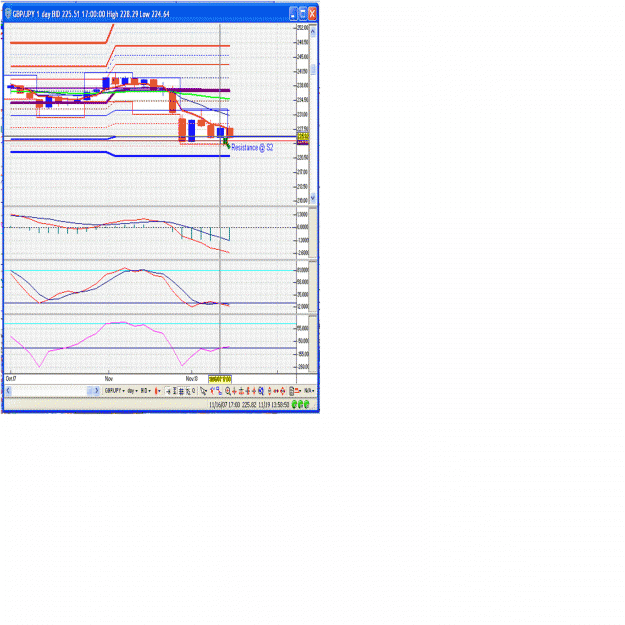
one more try, sorry I'm no tech guy. — image If you can read it, it shows the day before (thurs) and Friday both testing S2 at 225.82. That is why the day chart should always be referenced because you never know what you are "not" seeing. ...
The Art of Trading with MTF Stochastics
- PipAV8tor replied Nov 19, 2007
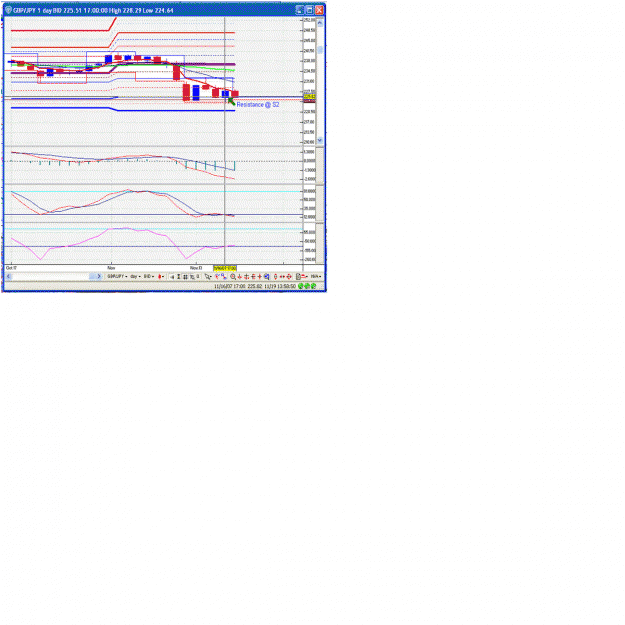
better shot — oops! I guess the better shot is too big. Enjoy the same picture for a 2nd time!!
The Art of Trading with MTF Stochastics
- PipAV8tor replied Nov 19, 2007
Screen shot of Resistance — Here is the day chart from last Friday that shows resistance at S2 and why the trade for a sell did not develop and turned into a buy opportunity
The Art of Trading with MTF Stochastics

- Posts by Member Search: 'PipAV8tor'