- Search Forex Factory
- 23 Results (1 Thread , 22 Replies )
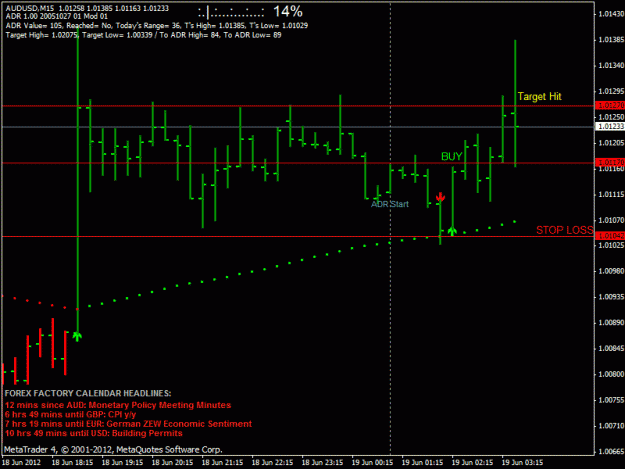
- Pip Maker replied Jun 18, 2012
Just got 10 pips from AUD/USD trade. image
Easy entry system: coloured candles
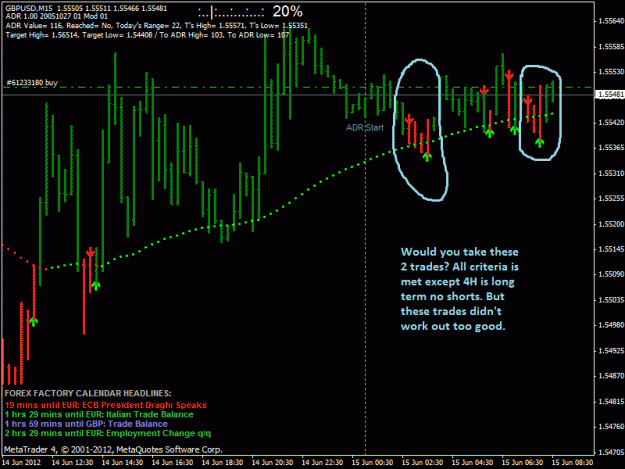
- Pip Maker replied Jun 15, 2012
image And its 19 minutes prior to news, oops...
Easy entry system: coloured candles
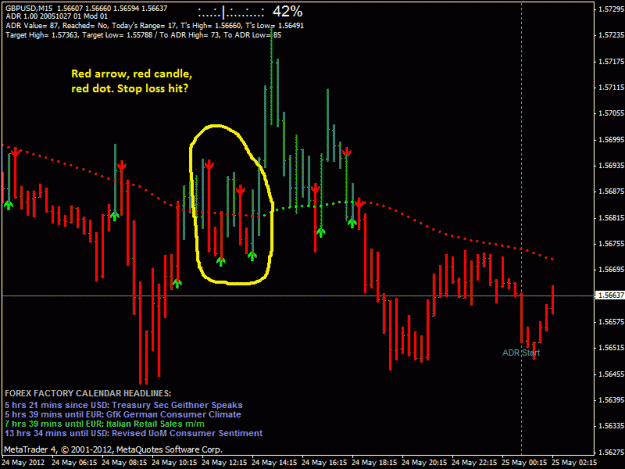
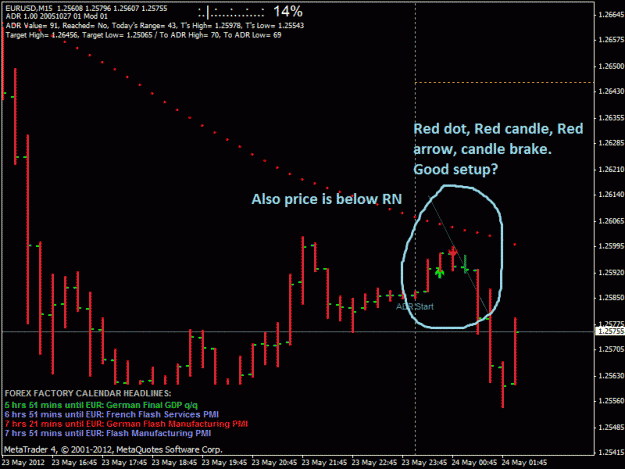
- Pip Maker replied May 24, 2012
You wrote that you use stop loss the bottom of signal candle for buy and for sell the top of signal candle is that correct? Please explain the signals that appeared on the chart below. Thanks. image
Easy entry system: coloured candles
- Pip Maker replied May 23, 2012
The trend is down in 4H so sell signal is also more reliable image
Easy entry system: coloured candles
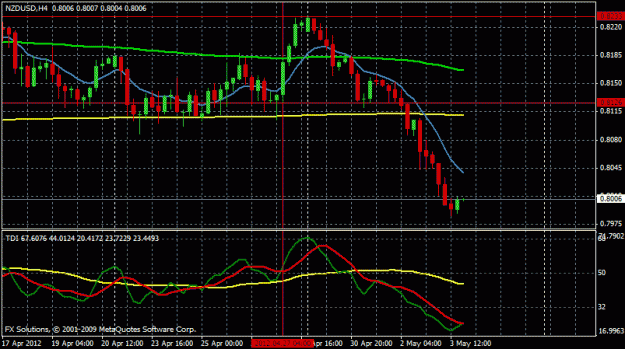
- Pip Maker replied May 3, 2012
Anybody think its a good time to go long on nzd/usd? Don't be silent, if you see something, share. image
Another simple system - Time-Frame 15
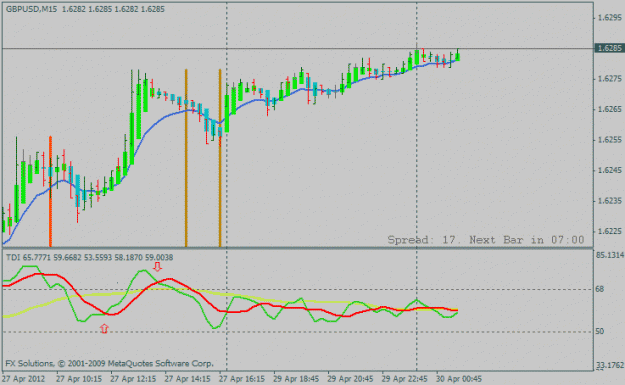
- Pip Maker replied Apr 30, 2012
image Good evening everybody. If you see on a chart that I posted there is 2 arrows on tdi indicator when it crosses under or above that yellow line. I wanted to see if anybody traded using that method trading anytime having to wait for London ...
Another simple system - Time-Frame 15
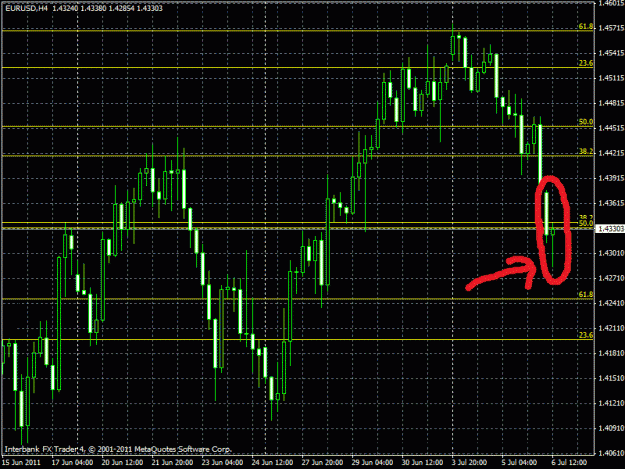
- Pip Maker replied Jul 6, 2011
I see a hammer on 4H plus RSI and Stochs shows oversold so I am going for a long. Also price is at fibo level right now so for me its a reversing sign. image
Circular Trendlines
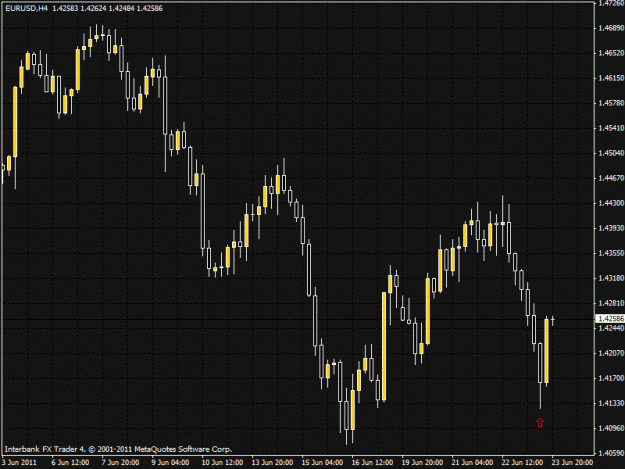
- Pip Maker replied Jun 23, 2011
Please take a look at my 4H chart and I don't even have a hammer. Its body is bigger than its tail. image
Circular Trendlines
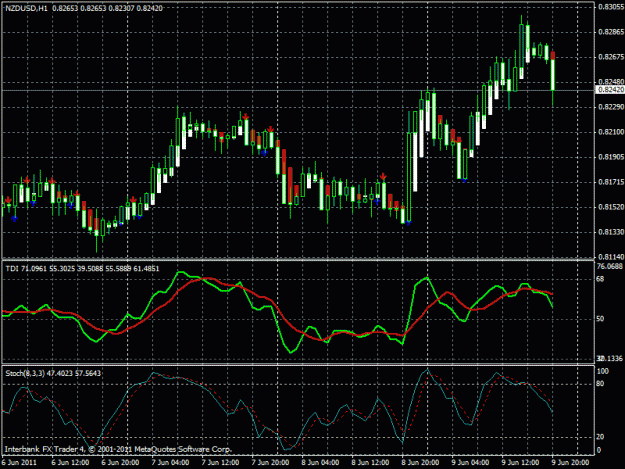
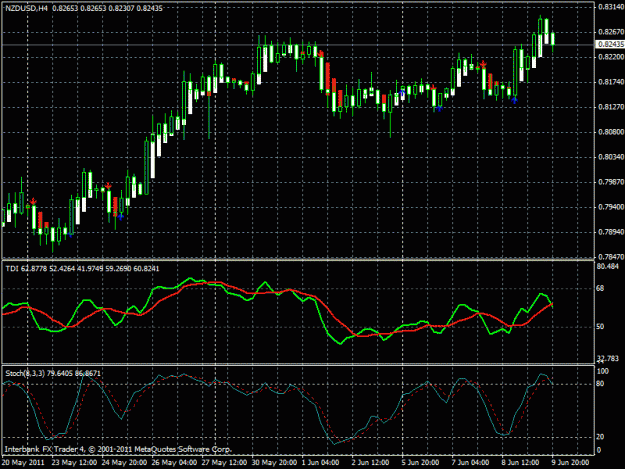
- Pip Maker replied Jun 9, 2011
There is a good setup for short on NZD/USD both 1H and 4H take a look at the charts. The first candle is big enough. Lets wait for the first candle to finish and if second candle is bearish then enter the trade? image image
Trading Made Simple
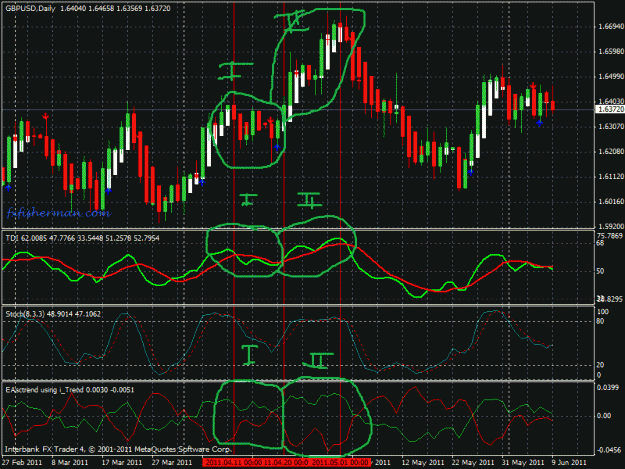
- Pip Maker replied Jun 9, 2011
Hey guys, I just added iTrend indicator to my charts and it doesn't really help with anything but I realized that it also can be used to escape fake signals or help us to stay in the position longer. I am just asking if you pro's think this is a ...
Trading Made Simple
- Pip Maker replied Jun 6, 2011
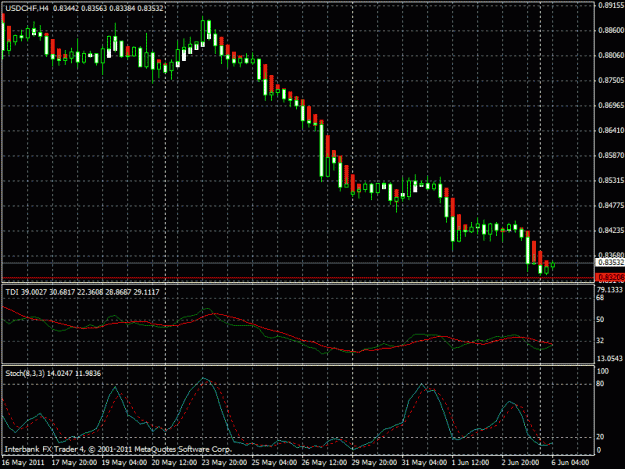
Do you guys think this is a signal to buy for USD/CHF? I know that its second candle already and its a weak one but looks like its over sold and TDI is crossing and its way at the bottom. Let me know what you guys think. This chart is 4H and on 1H ...
Trading Made Simple
- Pip Maker replied May 25, 2011
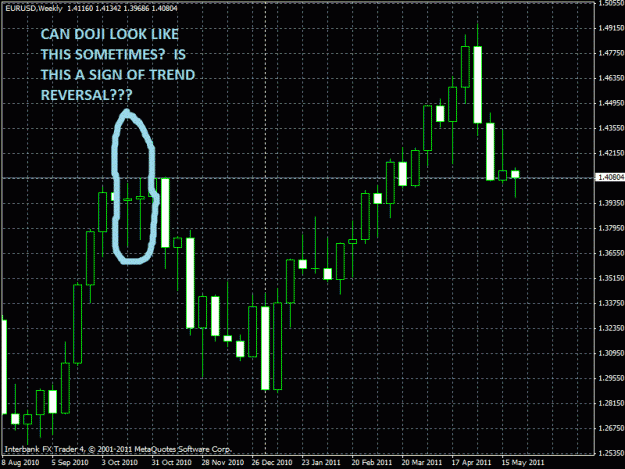
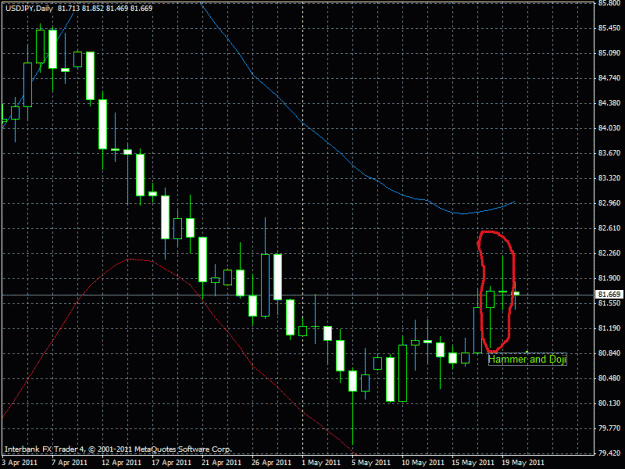
I know that 2 candlesticks of DOJI is a sign of potential reversal, but the ones on the chart do not look like DOJI, can DOJI look like the one candlesticks I circled on the chart? image
Let's Learn Candlesticks Together
- Pip Maker replied May 25, 2011
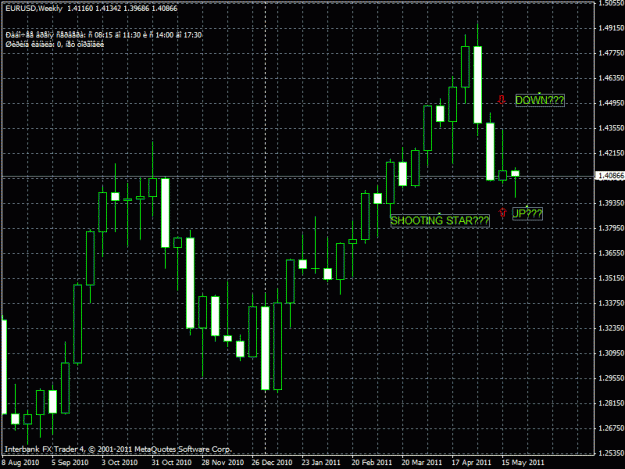
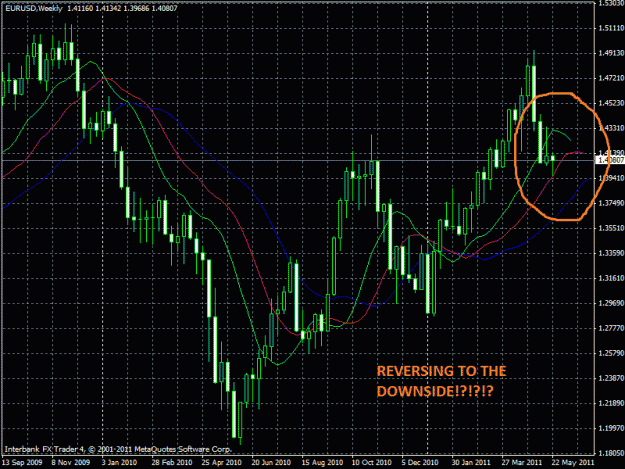
Hello fellas. Im posting Weekly EUR/USD charts. It might not be a good chance to look at weekly chart but tell me what you think. image image
Let's Learn Candlesticks Together
- Pip Maker replied May 21, 2011
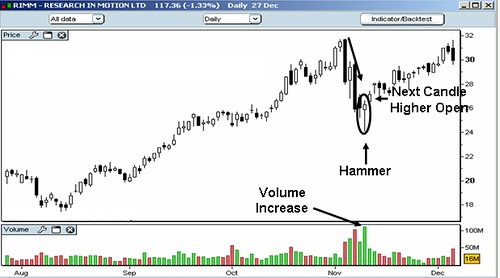
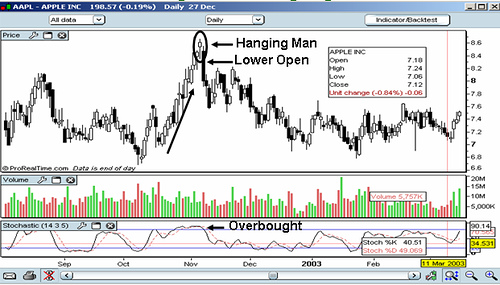
Brother, here is a picture that described where the hammer and where the hanging man is.
Let's Learn Candlesticks Together enjoy image image
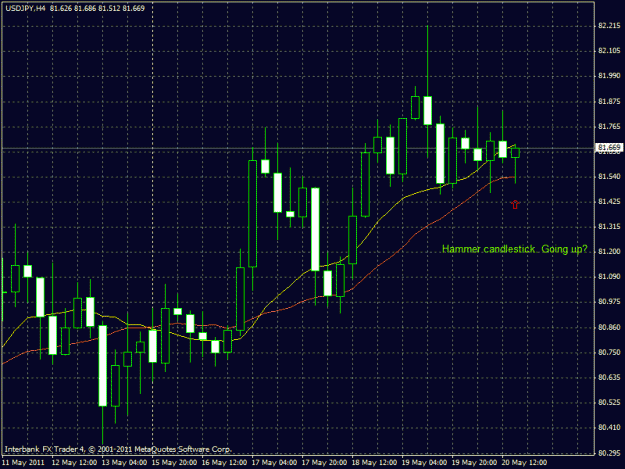
- Pip Maker replied May 20, 2011
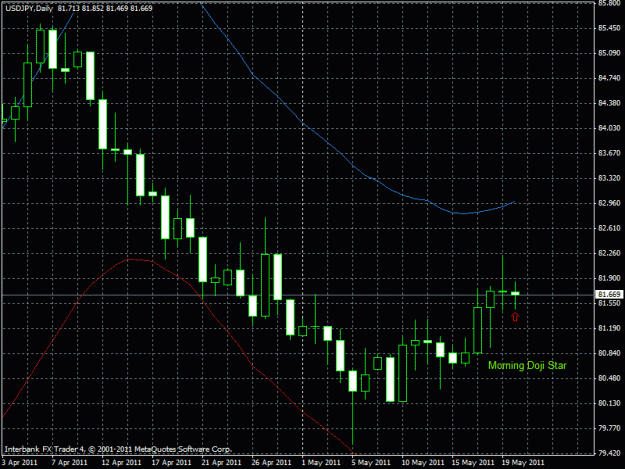
This is third confirmation that makes buy signal stronger. There is a Doji candlestick right after the hammer. Tell me what you think if you see something else that I don't see even if its a good or bad sign. Thanks image
Let's Learn Candlesticks Together
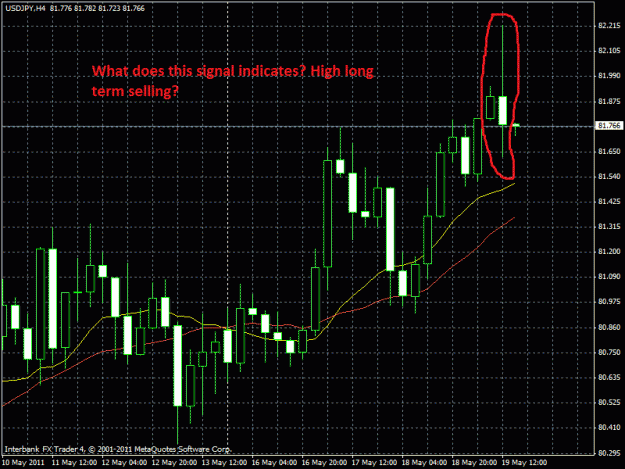
- Pip Maker replied May 20, 2011
This is the second chart for USD/JPY to prove and confirm that the buy signal is stronger and we doubled checked that by looking at different time frames. Lets wait and see next week where will it take us
Let's Learn Candlesticks Together image
image
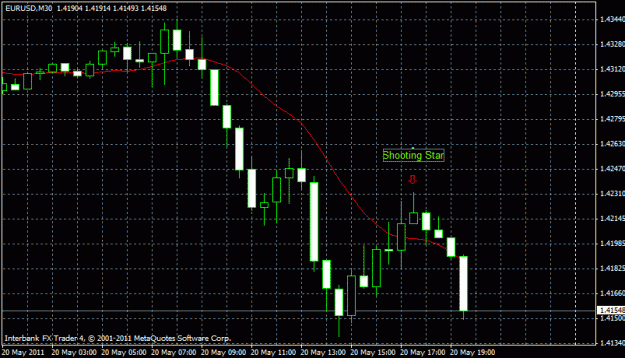
- Pip Maker replied May 20, 2011
What do you guys think fellas? image image
Let's Learn Candlesticks Together
- Let's Learn Candlesticks TogetherStarted May 19, 2011|Trading Discussion|35 replies
{image} If you look at this chart where there is 2 candles that I marked on the hill. Usually when ...
- Pip Maker replied Mar 3, 2011
Hello fellas. I joined this thread to see if Im on the same page with everybody here. I am selling eur/usd since today morning at price 1.3854 it didn't make any big moves yet but Im expecting it to go bearish. image
EURUSD
- Pip Maker replied Feb 16, 2011
USD/CHF closed at +20 GBP/JPY 1 position target hit +20 second position +95 because my broker only allows to put Target on first position only so I woke up with one position target hit and second position +95 So far for the week 483 I HAVE A PROBLEM ...
Minimum 100 pips a week...