- Search Forex Factory
- 39 Results
- Nipper replied May 21, 2008
Nice trade! — Looks like your TP 200SMA was hit at 1.9698. Nice pips! That purple trendline just above the 200 seems to be like a brick wall!
4 Hour Strategy (MACD)
- Nipper replied Apr 17, 2008
EURUSD trade — EURUSD LONG 1.5939 STOP 1.5909 (-30) LIMIT 1.6000 (+61) Long EURUSD based on 1 hour early entry open 8:00 GMT. Morning star formed on the 1 hour at the 7:00 GMT candle. Morning star on the 4 hour as well (and bounce off 8EMA). 4 ...
4 Hour Strategy (MACD)
- Nipper replied Apr 15, 2008
Hello Unlv_tj, I use it in the same way as Palmer. I have it set to 1. Basically to measure the candle length, without pulling out the pencil and paper! This is the 1 hour chart you see here the long candle, I marked the candle in question. It shows ...
4 Hour Strategy (MACD)
- Nipper replied Apr 12, 2008
EURUSD triple top — Hey Mike, The daily chart is showing another triple top resistance. Interesting, last time it found resistance at 1.49. It broke out 1000 pips and now resistance is at 1.59. The 1.64 level looks like a possible target if it ...
4 Hour Strategy (MACD)
- Nipper replied Apr 9, 2008
EURUSD — Hello bshadroo, I'm suspecting we may get a wide sideways range for a while as indicated by the 89 going flat. Similar to the sideways trend in January/February before the 89 sloped up and broke out to the upside. Whether it breaks up ...
4 Hour Strategy (MACD)
- Nipper replied Apr 4, 2008
Spinning tops — Good example of spinning top at resistance and support. Explanation courtesy of stockcharts.com Candlesticks with a long upper shadow, long lower shadow and small real body are called spinning tops. One long shadow represents a ...
4 Hour Strategy (MACD)
- Nipper replied Mar 30, 2008
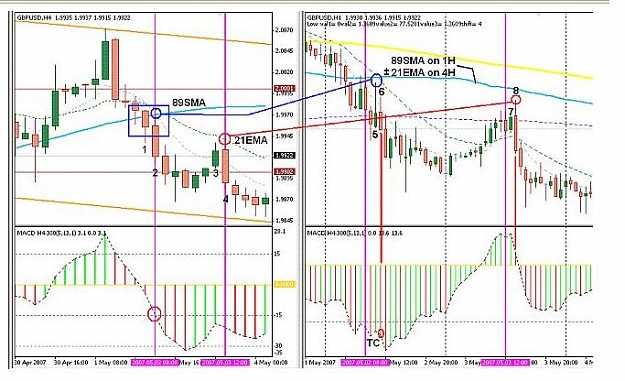
Trend lines/Channels — Hello Boris777, When market is trending between boundaries, the terms HH,HL,LH,LL are used to identify the bottom and top of the channel. Support and resistance areas. In reference to the current 1 hour GBPUSD chart, ...
4 Hour Strategy (MACD)
- Nipper replied Feb 20, 2008
Hi merrittb, Yes it sure did give me that "ah ha" moment! Good observation. When I saw your post it explained why I was having some difficulty in these areas. There is approx. 500 pip channel currently on the chart, therefore lots of trading ...
4 Hour Strategy (MACD)
- Nipper replied Dec 16, 2007
GBPUSD — Hello bshadroo, Good observation. I don't normally trade this pair, but I've been watching that 200SMA on the daily for a while. And there has been talk about it previously on the thread. It's been supporting there for the last year ...
4 Hour Strategy (MACD)
- Nipper replied Oct 29, 2007
Yep! The 8 EMA is supporting — Hi Palmer, Gotta agree with you on the 8EMA. It's been riding it for a while now. I took this RT on the 1 hour gravestone. Divergence between the 2 doji's, and a failure to break above 1.4425 on those previous 3 ...
4 Hour Strategy (MACD)
- Nipper replied Oct 19, 2007
Funny! — That's funny Ira
4 Hour Strategy (MACD) ! And, I have no water for a whole day! не шучу! RT on E/U this morning on the 4:00 candle GMT+1
- Nipper replied Oct 10, 2007
EURUSD — I can't make out the chart at the moment. Many contradicting signals and patterns. UP? 1. Break above trendline 2. MACD 4 HR currently bullish 3. Bullish flag pattern possibly developing?? DOWN? 1. Divergence 1 hour 2. 89 EMA ...
4 Hour Strategy (MACD)
- Nipper replied Aug 16, 2007
congrats! — Excellent trades on the GBP and EUR....congrats! Yes price is currently supporting right on the 200SMA on the daily. I connected bottom channel support lines on the lows going back 2 years, Oct 13/06, Mar 10,06 and Feb 27,06 and ...
4 Hour Strategy (MACD)
- Nipper replied Aug 6, 2007
Hi Nadia, Your analysis is very good. I was a little concerned about the short trade being risky as well. Looks like there was a follow-through and the tail got filled. And, now in consolidation. I have a question regarding your chart. The yellow ...
4 Hour Strategy (MACD)
- Nipper replied Jul 30, 2007
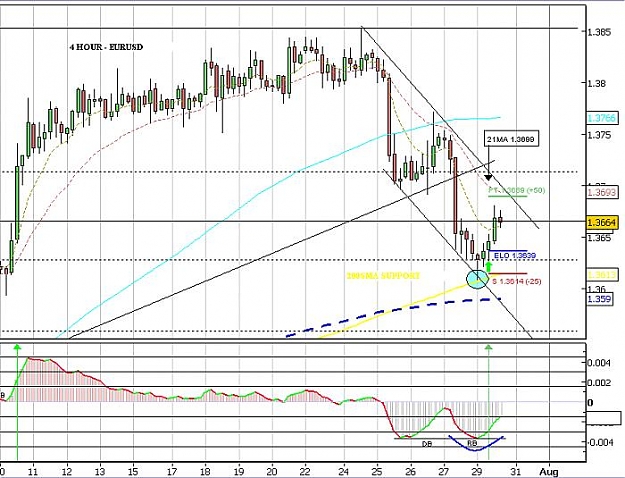
EURUSD — Hello Ryanmcd, Yes, I saw that trade this morning when I woke up, but missed it because I was sleeping. My platform showed a entry on the 4:00 candle (GMT+1) at 1.3839. Stop below the previous candle. PT just below the 21MA (also ...
4 Hour Strategy (MACD)
- Nipper replied Jul 29, 2007
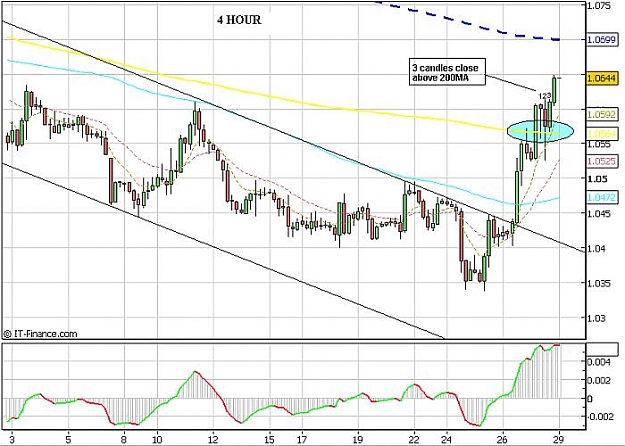
Yep! — Right on Phillip! You were exactly right. After that clean break above the 200, the next 3 candles closed above, and then another move up!
4 Hour Strategy (MACD)
- Nipper replied Jul 27, 2007
OK, I think I know the one now it's post 4063. It's actually a .jpg (not .pdf) that was posted in relation to the mp3 Here's the .jpg
4 Hour Strategy (MACD)
- Nipper replied Jul 14, 2007
Sterling triangle — BIL2205, I believe this may be the triangle........
4 Hour Strategy (MACD)
- Nipper replied Oct 9, 2006
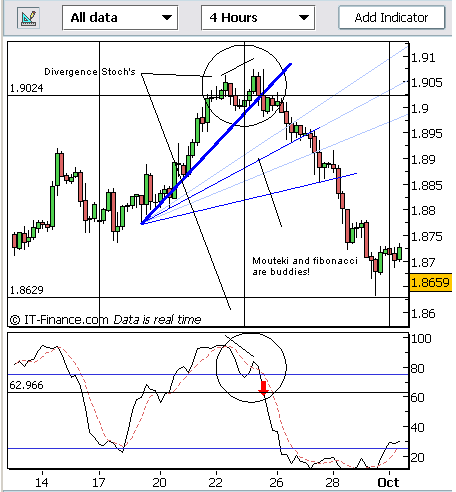
Stochastic, fibonacci, and Mouteki — Perhaps this should be posted on the Mouteki filters, but anyways - here goes. I also use the stochastic as a filter for the Mouteki lines. But, I'm not sure if I use it in the same way as you. As a simple ...
Mouteki Trading