- Search Forex Factory
- 18 Results (2 Threads , 16 Replies )
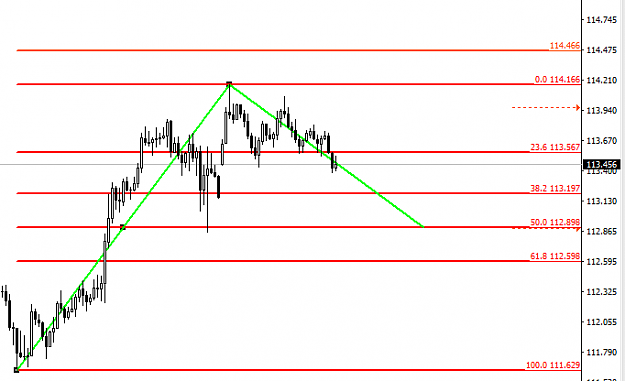
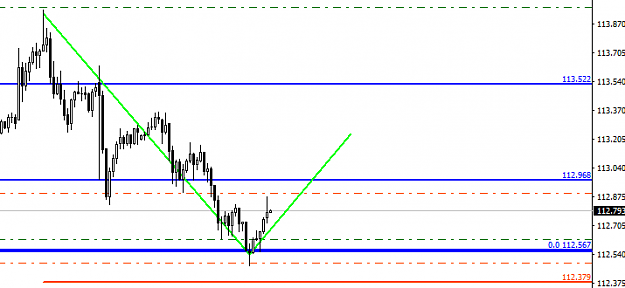
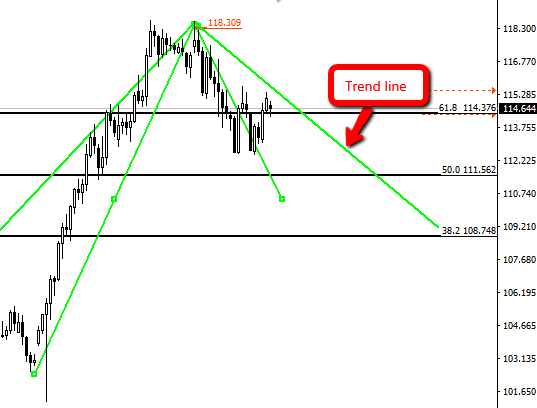
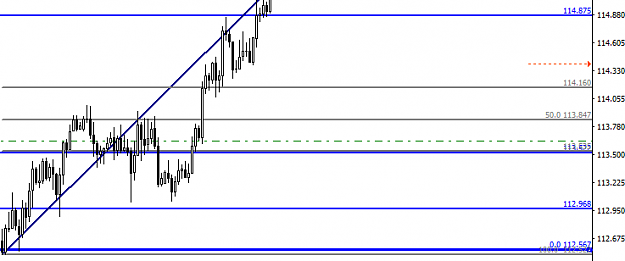
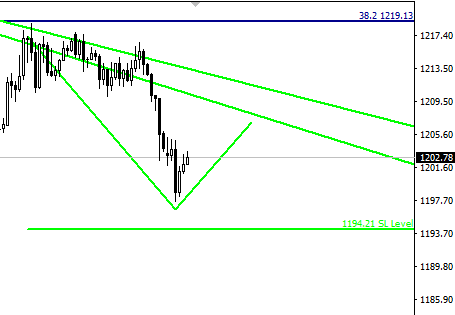
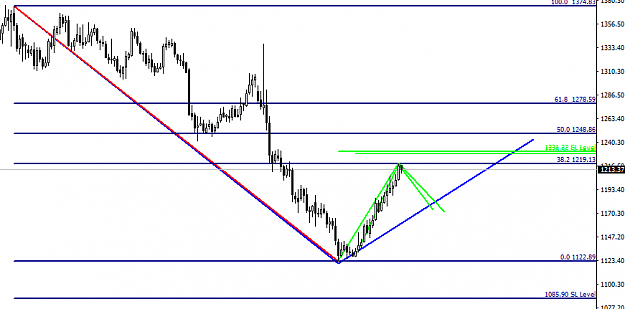
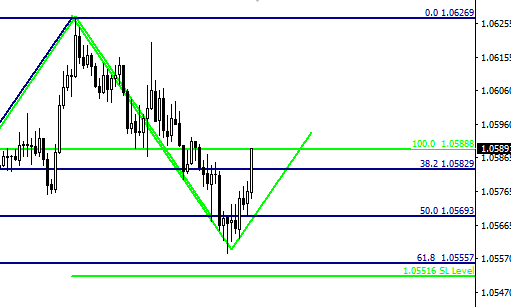
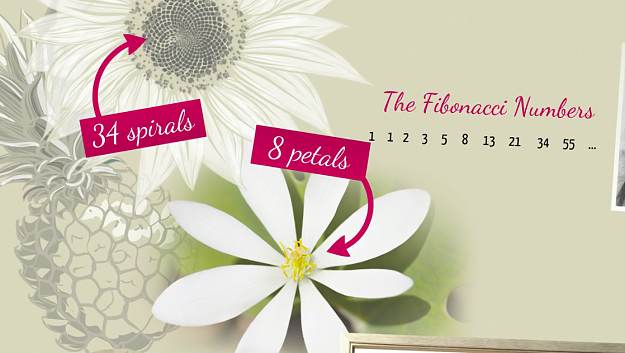
- Narenraj replied Feb 14, 2017
Usdjpy is out from bottom trend line in H1 Time Frame-Channel and holding and the price holding near support level at 113.475. If 113.47 level is breached then the next support will be at 113.039 Fed chair Yellen Testimony on economic growth and USD ...
- Narenraj replied Feb 2, 2017
Doji formation at support 112.56. Taken a position at 112.62, TP 112.87, SL 112.473. Fundamentals seem's to be weak in dollars, but still willfully taking a position at support, hoping trump will take measures to strengthen dollars. image
- Narenraj replied Jan 30, 2017
My weekly projection on UJ. Dollar holding 61.78% of previous swing 123.48 to 99.64. If 61.8 Fibonacci retracement level is breached, Dollar can find its next support at 111.56, image Last week US GDP disappointed dollars growth, but this week ...
- Narenraj replied Jan 27, 2017
As expected usdjpy successfully reached 114.780 and my target achieved, my next resistance is at 155.588, image
- Narenraj replied Jan 25, 2017
Yesterday, as projected UJ successfully out of two resistance level and a successful re-test of 113.522 and pull back, can take UJ to 114.780 image
- Narenraj replied Jan 23, 2017
UJ is at support, If the bulls takes over jpy then it may follow the projected movement which is indicated in green in chart, and there are two resistance for UJ to break, 1st resistance at 112.99 and 2nd at 112.52, If UJ breaks the projected ...
- Narenraj replied Jan 19, 2017
TP hit in gold but my projection on gold is still down, image
- Narenraj replied Jan 18, 2017
Gold is rising and shining whether the trend continues downside or break 38.2FR Level and change the direction will have to wait and watch, meanwhile, I prefer going short in gold with the stop loss at 1228, and all the way down below 1200. image
- Narenraj replied Jan 10, 2017
EU should bounce back to 1.05829. If EU breaks below 1.05516 will be considered as trend reversal in 15M image EU TP achieved 1.058 image EU have support at 1.05117. Eur have good chance to pull back to 1.05310 image SL at 1.05051 SL hit ...
- Narenraj replied Jan 10, 2017
SL HIT image
- Trade with MathMagic Numbers
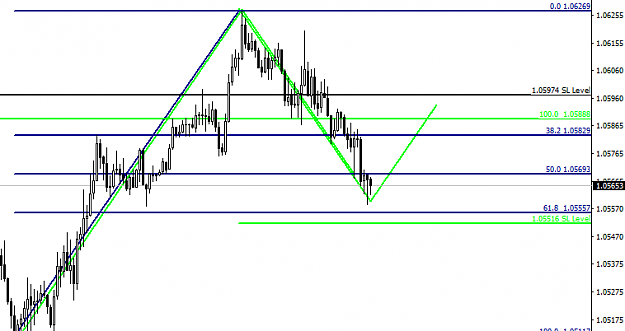
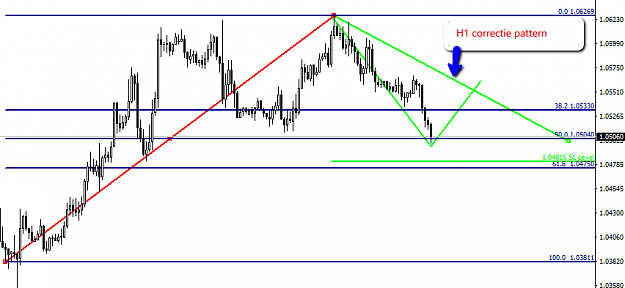
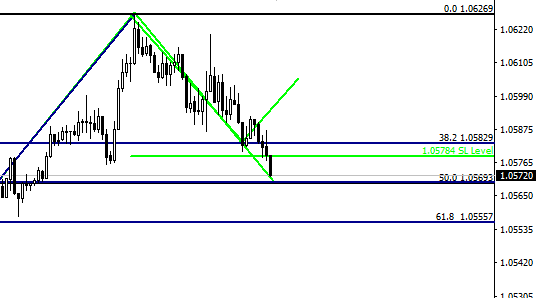
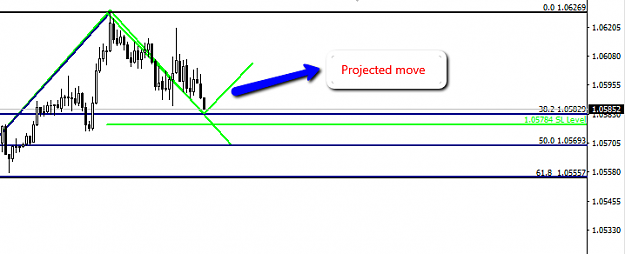
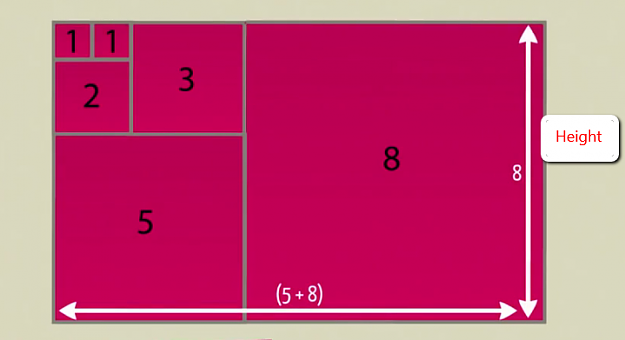
I would like to show you the trading opportunity using the favorite collections of numbers. The ...
- Narenraj replied Dec 15, 2016
image SNB Interest rate decision and press conference ahead in 2 hours.
- Narenraj replied Dec 14, 2016
USDCHF trading below 200SMA and at 61.8 Fibonacci retracement level. The formation of pin bar in H1 chart is last hope of bulls power, The breach of 61.8 Fibonacci retracement will add a more bearish sentiment. However, we can expect the pair to be ...
- Narenraj replied Dec 12, 2016
Golden Cross formation in USDCHF pair. What is Golden Cross? Golden cross forms when a 50 days short term moving average crosses above 200 day moving average on technical charts, It confirms the strength of long-term trend “Bullish Indicator”. ...
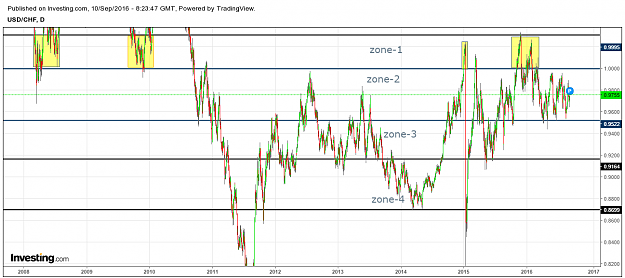
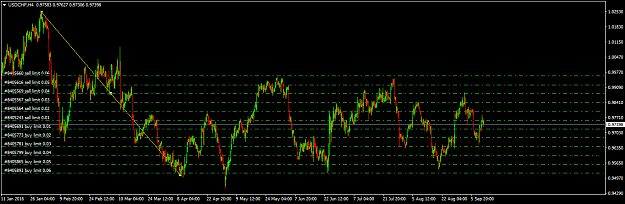
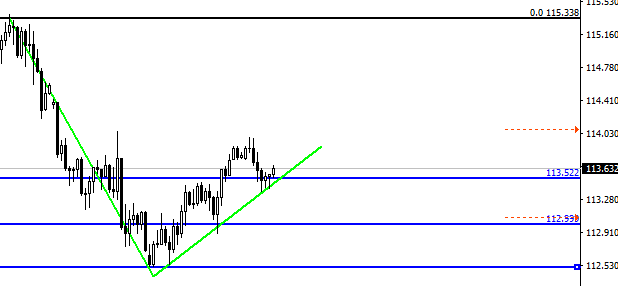
- USDCHF is trading in range, will Martingale work?
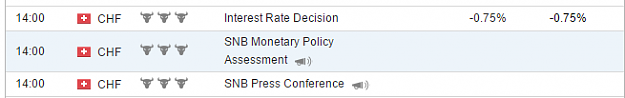
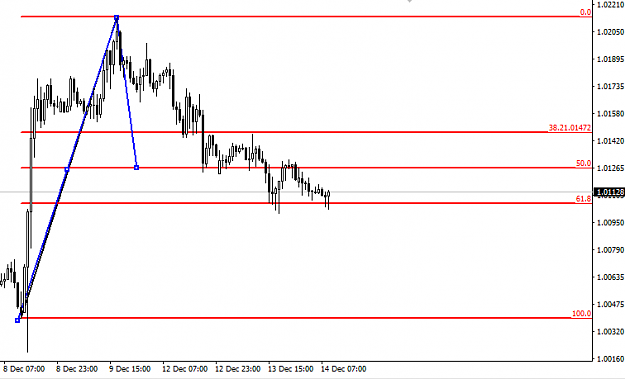
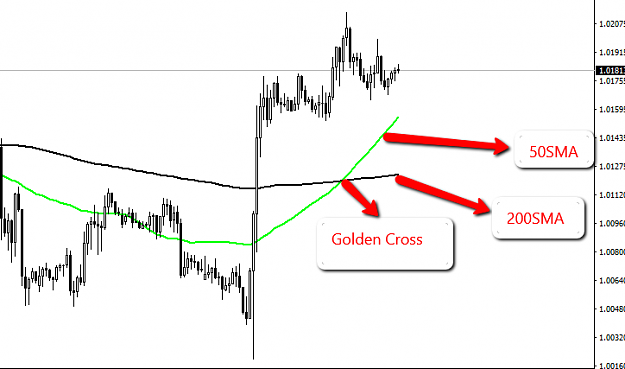
USDCHF is trading in range, Will Martingale works on this strategy???? The Swiss franc currency is ...
- Narenraj replied Nov 30, 2016
Based on Fibonacci retracement tool. I long in eurusd from 1.0634 and my SL is at 50% of retracement, and TP is at 0.0% FR level. take a look at the chart attached and please tell me whether its a right decision to hold or should I close.
- Narenraj replied Nov 28, 2016
Though EurUsd is on the downtrend, going short position is prone to risk since euros is trading year low and breaching this level could lead euros to historic low. I would rather wait for a trend reversal signal instead of selling at this point.
- Posts by Member Search: 'Narenraj'