- Search Forex Factory
- 32 Results (3 Threads , 29 Replies )
-
 NYWallSt replied Feb 16, 2021
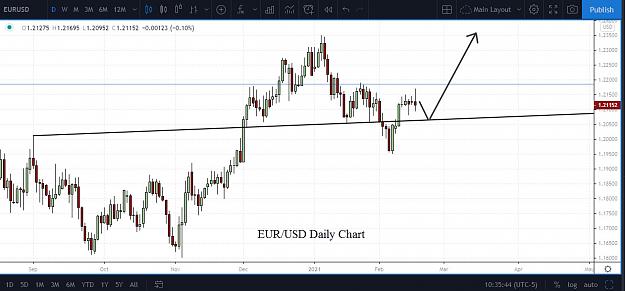
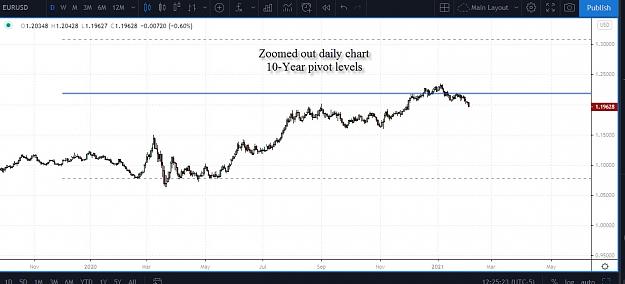
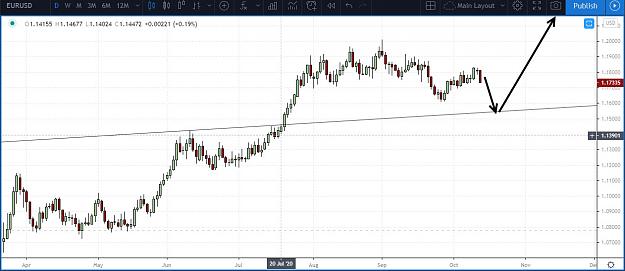
Meant to add in chart. I'm watching for this move to play out. Considering that I see bullish on the Monthly/Quarterly chart, I'm preferring to buy on dips for the next potential 500+ pip move. image
EURUSD
- NYWallSt replied Feb 12, 2021
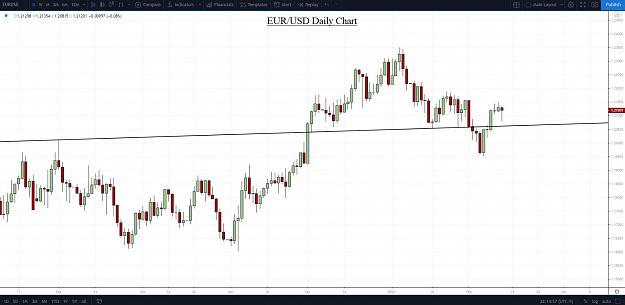
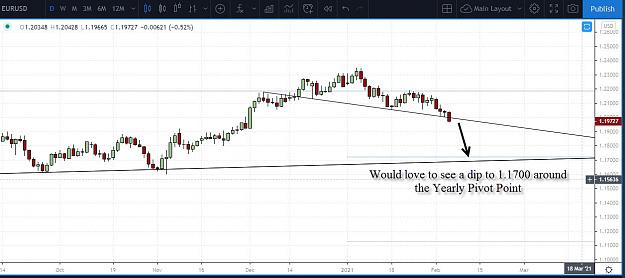
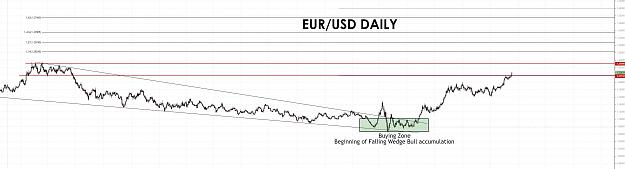
Sold my long position for 70 pips but although I'm overall bullish and was planning to hold, it looks like EUR/USD is going to pullback a bit. I'll be looking to reload possibly around 1.2070 - 60. Daily Chart - Looking at that trendline level as a ...
EURUSD
- NYWallSt replied Feb 4, 2021
Long Term (Coming Months) I'm still Bullish on the Euro however this looks to be a decent pullback. Once it started cracking the daily trend-line that was holding some support the last 2 days, I exited my longs and entered short at 1.1987. I would ...
EURUSD
- NYWallSt replied Dec 18, 2020
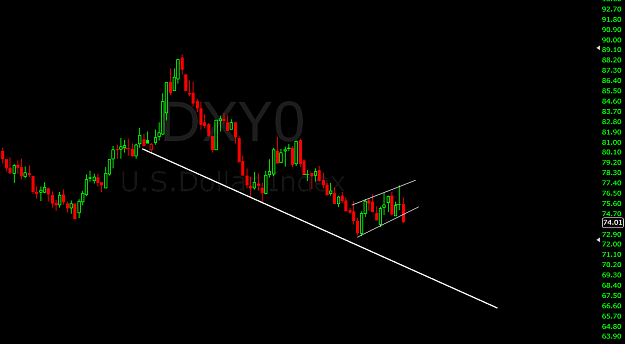
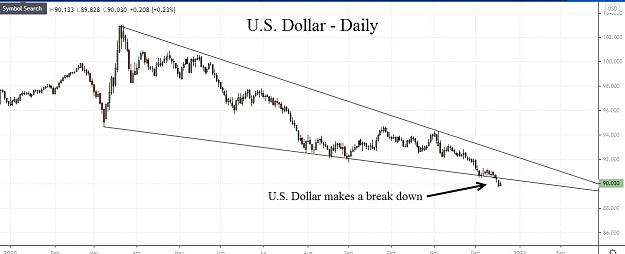
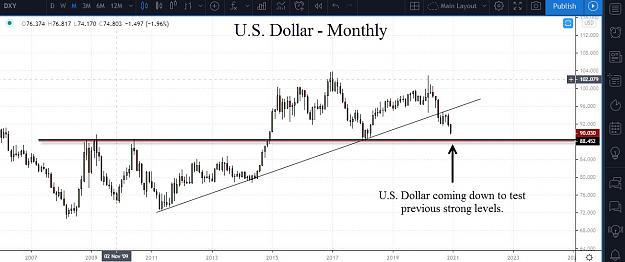
Close of the week so nothing else to report however checking out the USD (DXY), Things look bearish to me so i'm wondering if Euro pops to 1.2300 -1.2400 next week.
EURUSD
- NYWallSt replied Dec 17, 2020
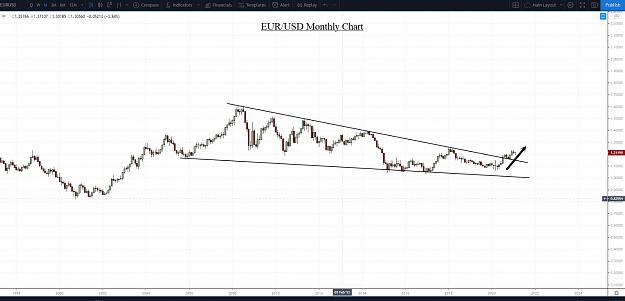
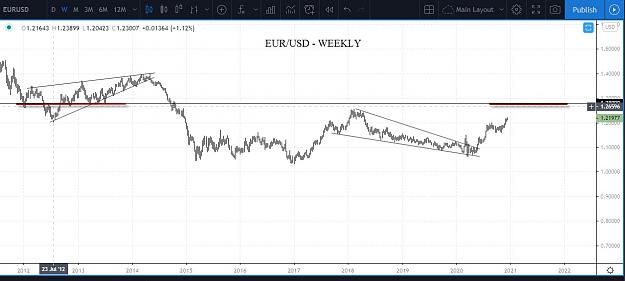
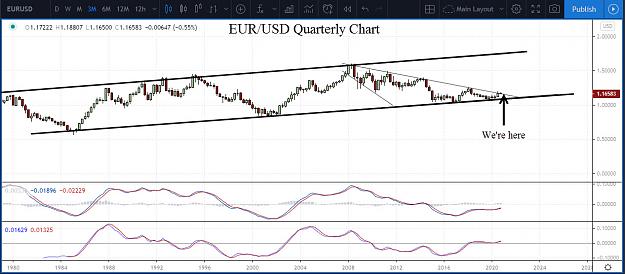
On a shorter outlook, it appears that the previous 1.2150ish zone of resistance has been cleared and next target for buyers could be the 2018 high around 1.2500. On the longer term view of the Monthly and 3 Month (Quarterly) charts, I'm preferring ...
EURUSD
- NYWallSt replied Dec 16, 2020
Letting it rock. Been going long since May EUR/USD. I'm aiming for 1.2800 zone. First, we'll see how 1.2200 holds up.
EURUSD
- NYWallSt replied Oct 29, 2020
Still waiting for the Euro to come down some more to initiate a long position. 1.1550ish is what i'm looking for. Right now the election is going to potentially throw price all over the place. Next week's economic news lineup is packed. Daily and ...
EURUSD

- NYWallSt replied Oct 13, 2020
Fucked myself on adding more positions around 1.1800 and closed all my longs from July because I didn't want to stay stuck holding negative positions. Still made good money but now I'm looking for what looks like a nice dip coming into the mid ...
EURUSD
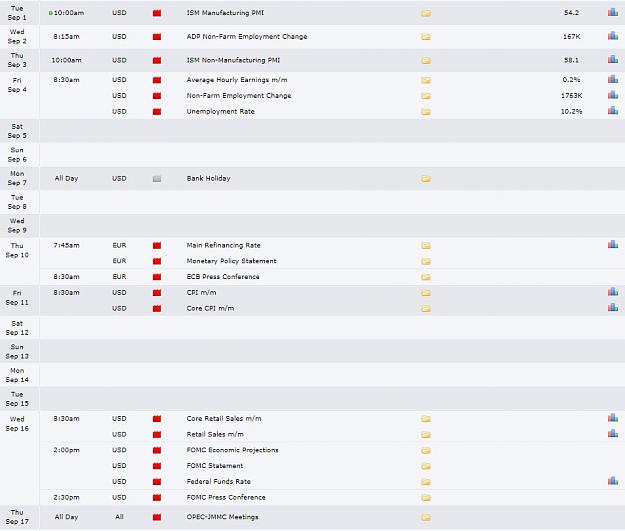
- NYWallSt replied Aug 27, 2020
Hang on to your nut sacks. The Market is waiting for the upcoming September data to be released. (Overall I'm bullish though).
EURUSD
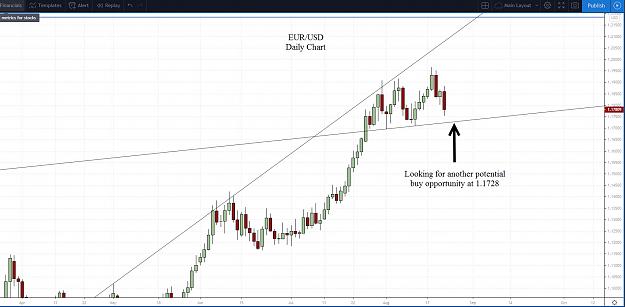
- NYWallSt replied Aug 21, 2020
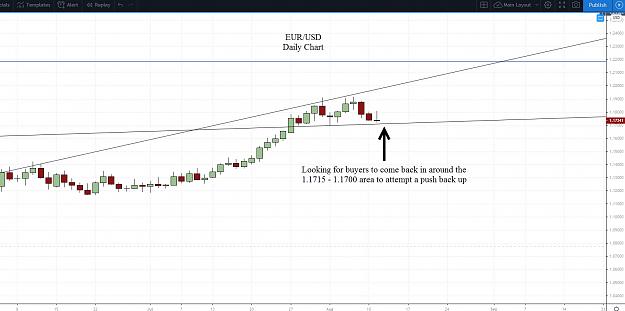
The bears wanted to come out and play a little, I was kind of hoping this would happen so I can potentially add more longs but I'm going to keep my eye on the 1.1728 - 1.1722 level as shown in the chart. Current long positions: 1.1197 1.1708 1.1712
EURUSD
- NYWallSt replied Aug 18, 2020
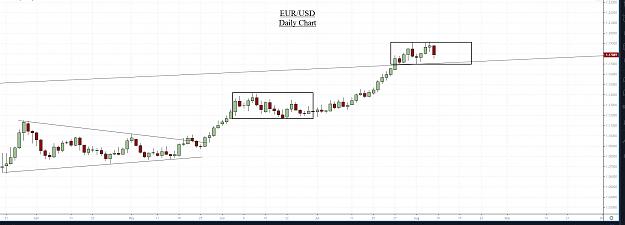
Ready for the next move? We'll have to stay tuned for tomorrow but looks like the next wave up has potentially begun. IMO we either pull back into the 1.1880-90 area and then head up the following days or the bulls just keep on running towards ...
EURUSD
- NYWallSt replied Aug 12, 2020
Nice touch of support and bump back up. I'm thinking we will continue up around to or close to 1.2200 in the coming weeks before we see a decent move down and even then, that will be a pullback for a continuation above 1.2200.
EURUSD
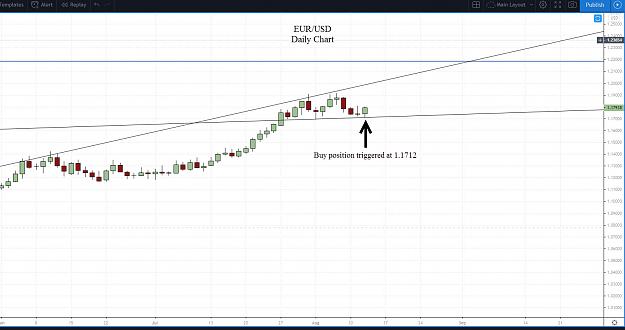
- NYWallSt replied Aug 11, 2020
Have a limit buy order at 1.1712. Original strong position remains at 1.1197. Added another buy days ago at 1.1708 but Euro has pulled back into support again. Watching for tomorrow morning.
EURUSD
- NYWallSt replied Aug 7, 2020
Looks like another potential pause in the uptrend. We'll see what happens next week. If we head down to the 1.1700 area, i'll look for another half position to add, until then. Nothing else much to do but let the market work it out.
EURUSD
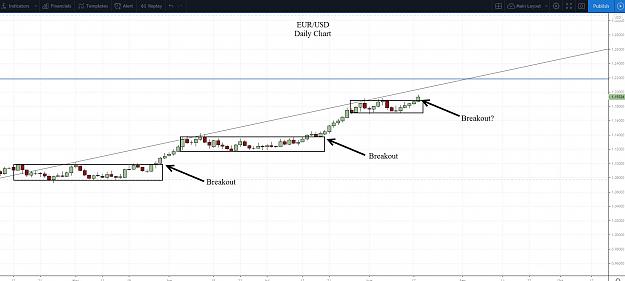
- NYWallSt replied Aug 6, 2020
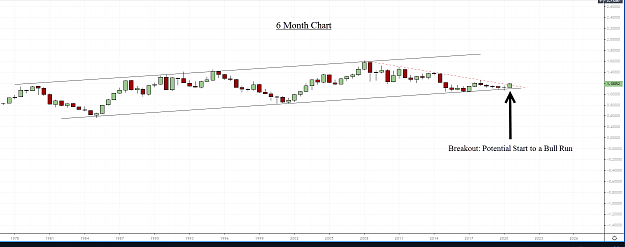
I'm holding on to my buy positions as long as I can. 6 month chart shows a potential breakout that could turn the overall trend around. Of course I expect pullbacks but things look very bullish as of right now. I'm aiming for 1.2800+ for a 1,500 pip ...
EURUSD
- NYWallSt replied Aug 5, 2020
Bullish Euro for Months to come in my opinion. I'll keep looking to buy the dips. I got rid of my long at 1.0905 but I'm holding another long from 1.1195 and added half a position yesterday at 1.1709. I always start from the top down and based on ...
EURUSD

- NYWallSt replied Sep 25, 2011
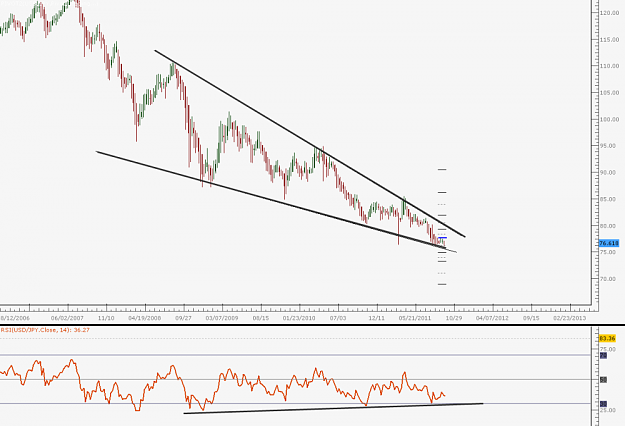
Weekly UJ chart, Falling Wedge with positive Divergence on RSI.
USD/JPY Discussion
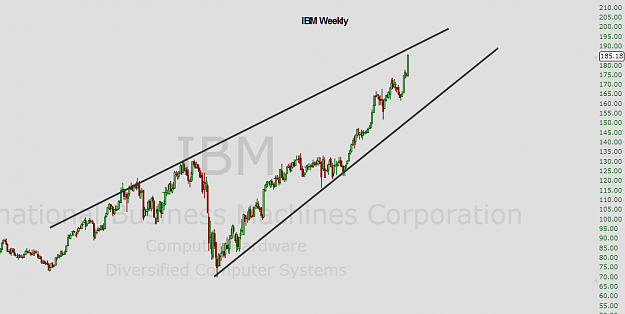
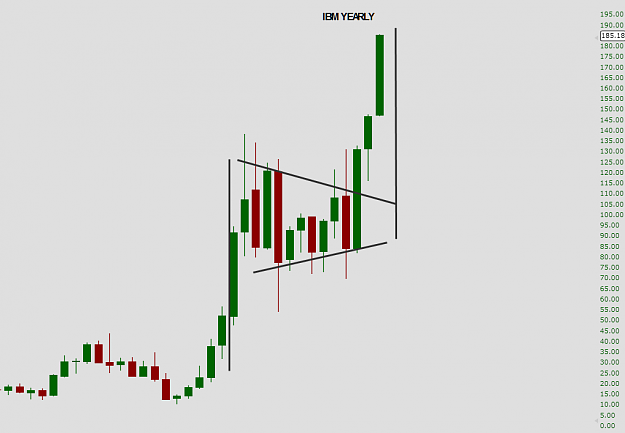
- IBM shortsStarted Jul 25, 2011|Trading Discussion|5 replies

IBM has been on a roll, has gone a bit parabolic. Very Strong resistance up at 189.That yearly ...
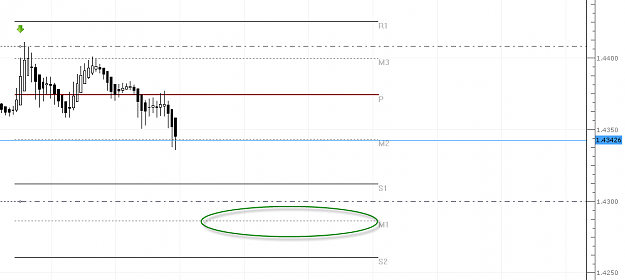
- NYWallSt replied Jul 25, 2011
May still have more to go, Looking to close out short at 1.4300 and a buyer in at around 1.4285 support.
EURUSD
- NYWallSt replied Jul 24, 2011
USD breaks out below its flag and closes on a weekly down. i expect a pullback and more selling towards 70 or even 69. Lets see if new lows can be taken this week.
EURUSD