- Search Forex Factory
- 29 Results
-
 Manekineko replied Nov 24, 2012
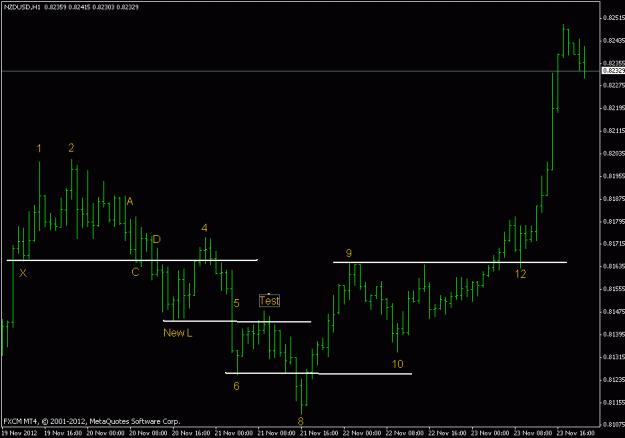
X is the low before an high bar 1. Bar 2 is when the market had the opportunity to mark up more it failed if you see the previous 2 bars are all closing on their highs. We want to see the reaction A D C are closing on their lows so sellers are ...
No Brainer Trades
- Manekineko replied Nov 18, 2012
Maybe this helps. Strenght is in the back ground.Strenght will disappear only when supply will hit the market or S/D supply swamping demand. The market is doing Higher highs and Higher lows this is the most important trend. Bar 4 is a probe of ...
vsa with Malcolm
- Manekineko replied Sep 21, 2012
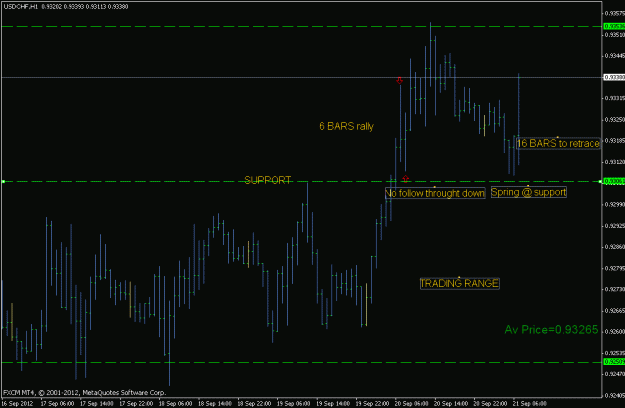
USD CHF — At resistance it breaks. There is an Up Thrust but no follow throught down. At the retest of the resistance there are two bars market like spring it means there is some buying at resistance now support. Because the market is ...
No Brainer Trades
- Manekineko replied Aug 16, 2012
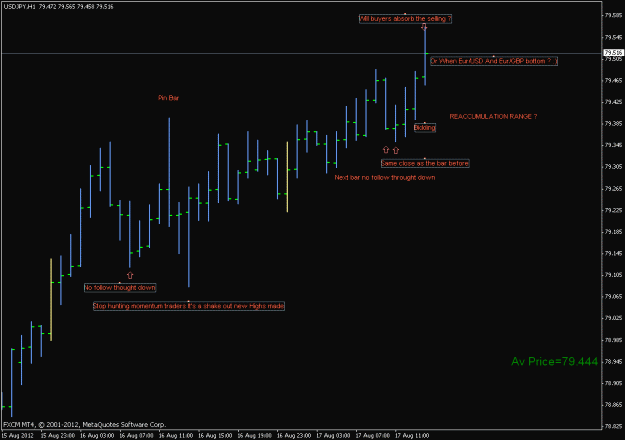
USD JPY — Accumulation range ? The stuff about the resting limit orders is in the first video on No brain trades link.
No Brainer Trades
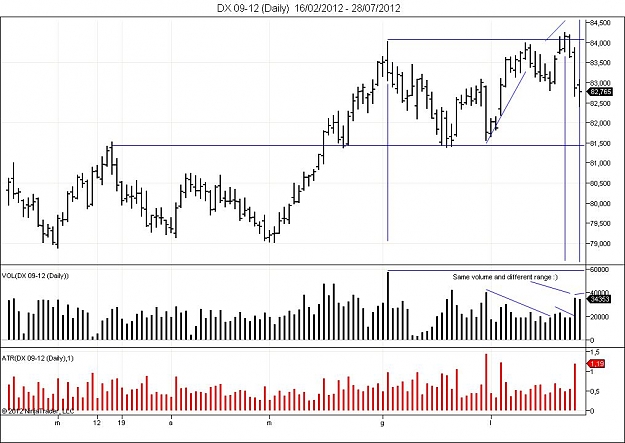
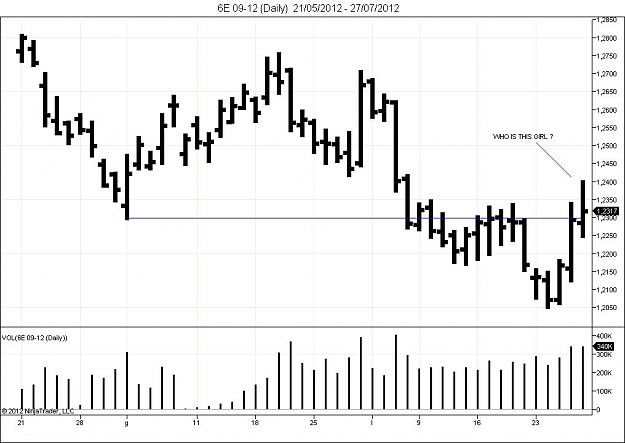
- Manekineko replied Jul 28, 2012
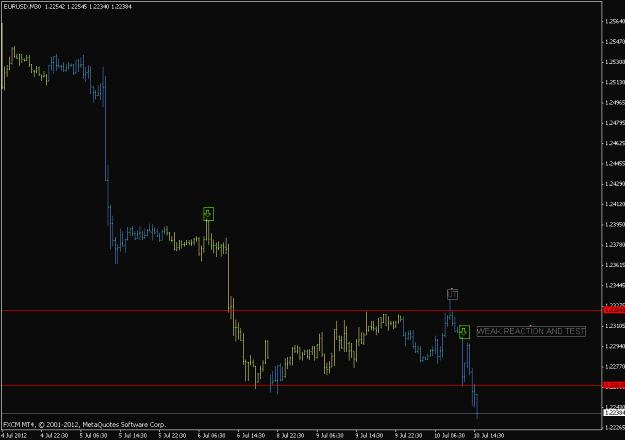
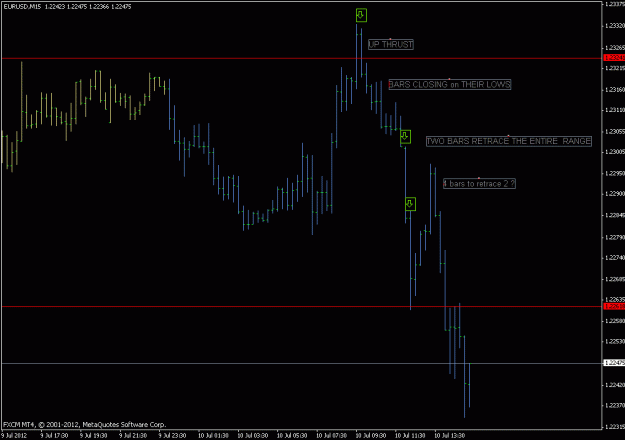
Where is the volume on Dollar index to sustain a break out ? Euro/USd retraced the entire range with one bar but...
vsa with Malcolm

- Manekineko replied Jul 18, 2012
Bar 1 chart 4H Shake out yes and no. It's no because if that was a shake out we had must to make new highs. Bar 1 close in the middle bar 2 close on the high bar 3 has a small range and the volume is reduced close on the high. Lack of demand Bar 4 ...
vsa with Malcolm
- Manekineko replied Jul 12, 2012
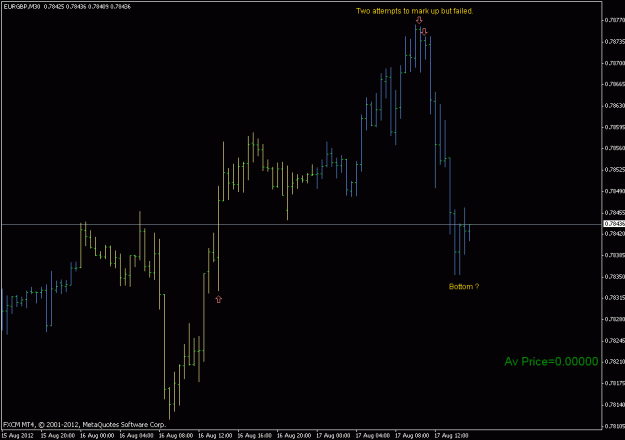
GBP/USD You can see on the chart why is on distribution. Up bars and the next down
No Brainer Trades
- Manekineko replied Jul 10, 2012
Thanks for calling me stupid
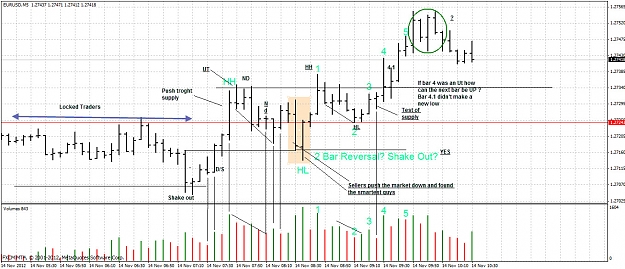
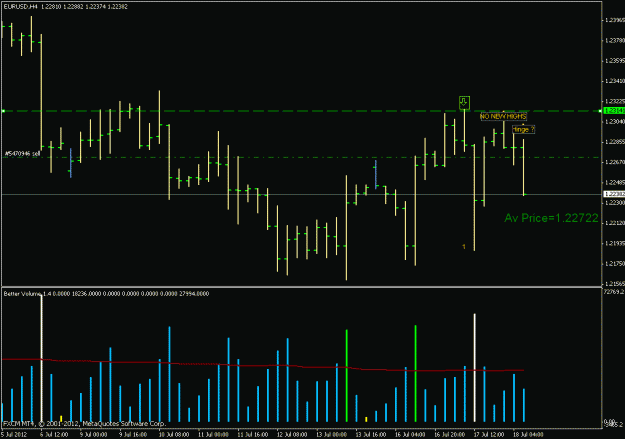
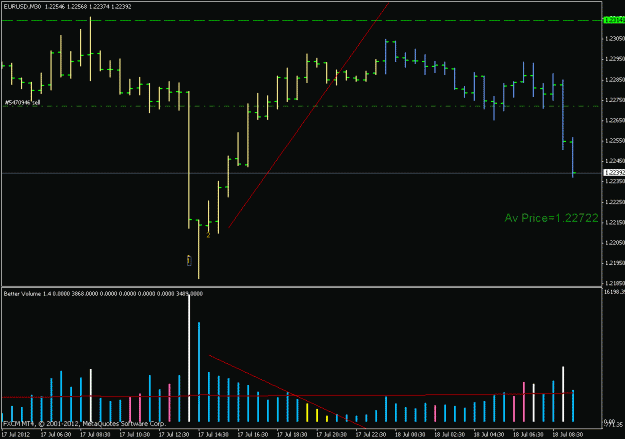
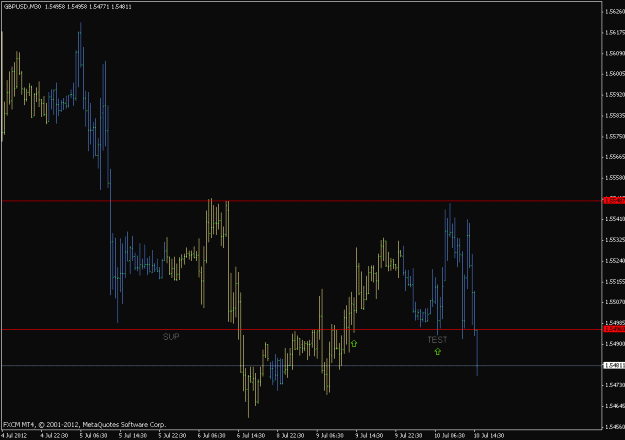
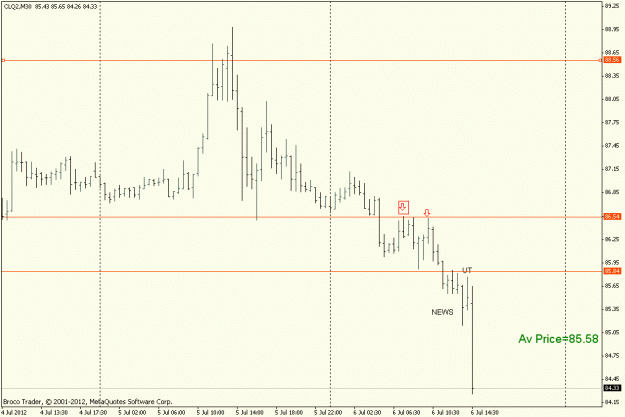
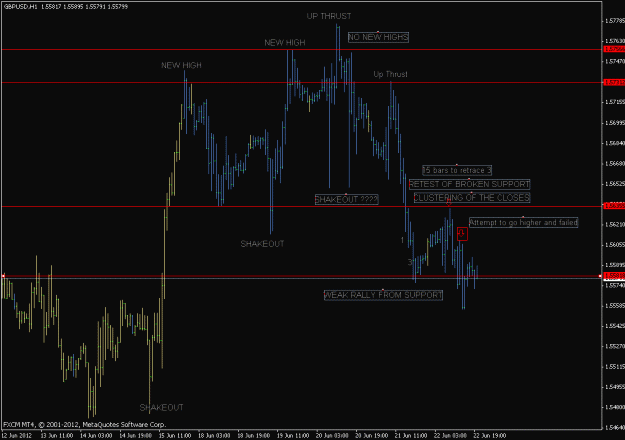
No Brainer Trades 4 bars to retrace 2 from support. = Weak reaction from support after an UT and a leg which retraced the entire range with 2 bars = SUPPLY in the market. 4 days of work wyped out by two bars.
- Manekineko replied Jul 7, 2012
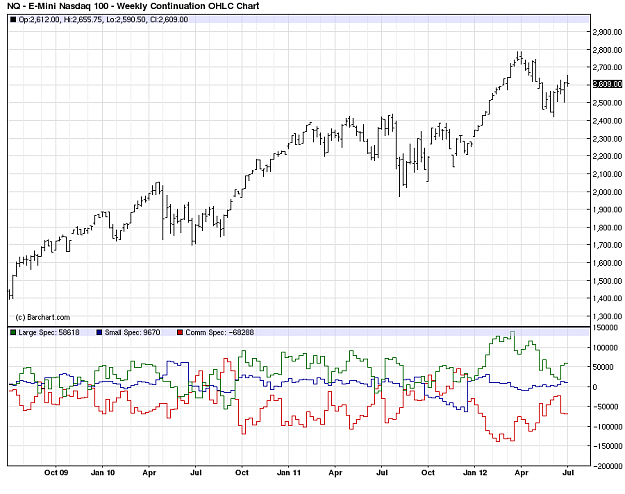
Nq is the speculative market it tend to lead ES. DJ is not the USA economy are only 30 stocks and they can be manipulated. Es are 500 stocks it's quite hard to manipulate 500 stocks.
NYSE & Nasdaq Yes Uncleti but i saw this video url I think and i'm in agree ...

- Manekineko replied Jul 6, 2012
Charts are CST we must to be in line with Chicago.
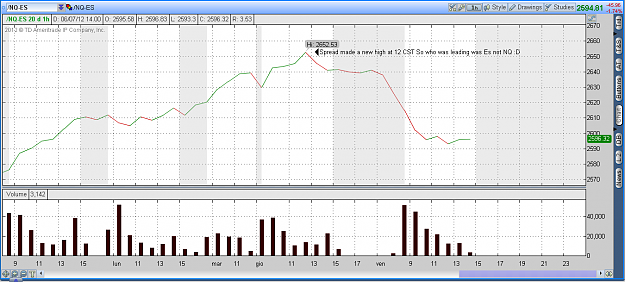
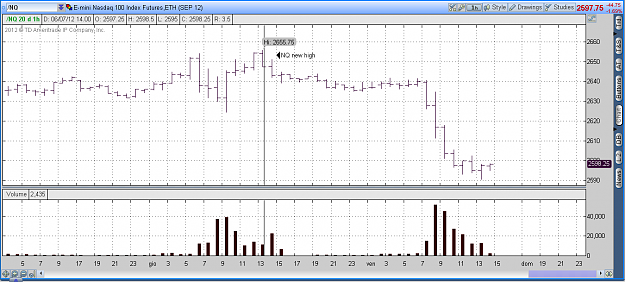
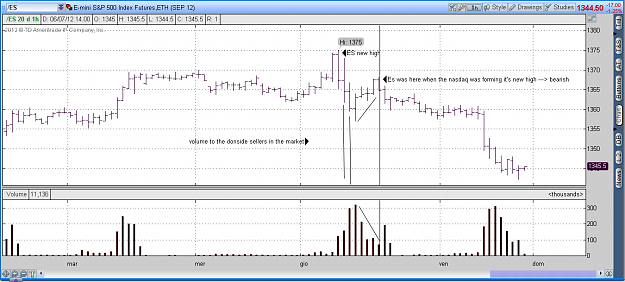
NYSE & Nasdaq The E mini and NQ CME open i know are not so perfect in the 1H TF  Plus there was the clustering of the closes in NQ daily or if you want lack of upside progress by the buyers so the sellers....
- Manekineko replied Jul 6, 2012
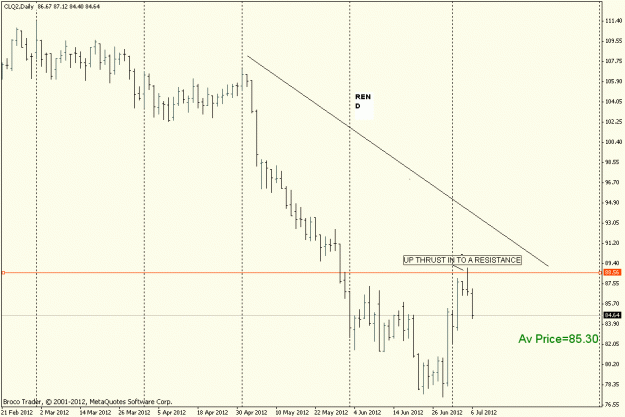
I know it has nothing to do with FX but Cl is a sort of friend of $ — Supports and resistances move accordingly to the price action in the now. Those are my conclusions. Black gold and $ they date but are not married.
No Brainer Trades
- Manekineko replied Jul 6, 2012
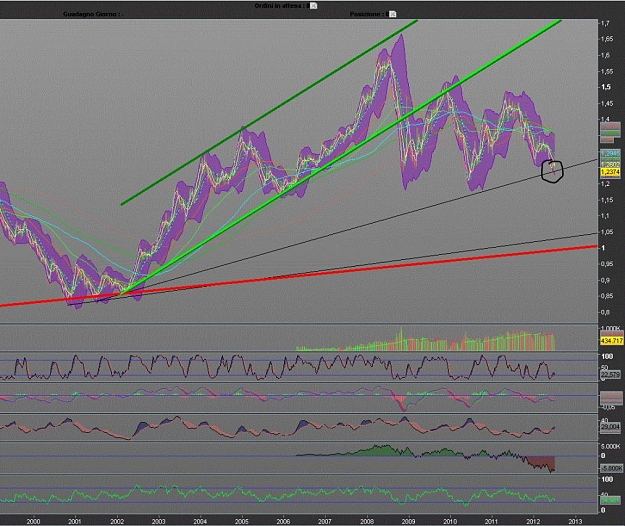
Heavy correlation about 99.9 % Some italian paints. Raffaello,Donatello Leonardo and Michelangelo (ninja turtles) are nothing in front of this. Look at the green dragon.
Charts on Drugs or works of Art? So cute.

- Manekineko replied Jul 5, 2012
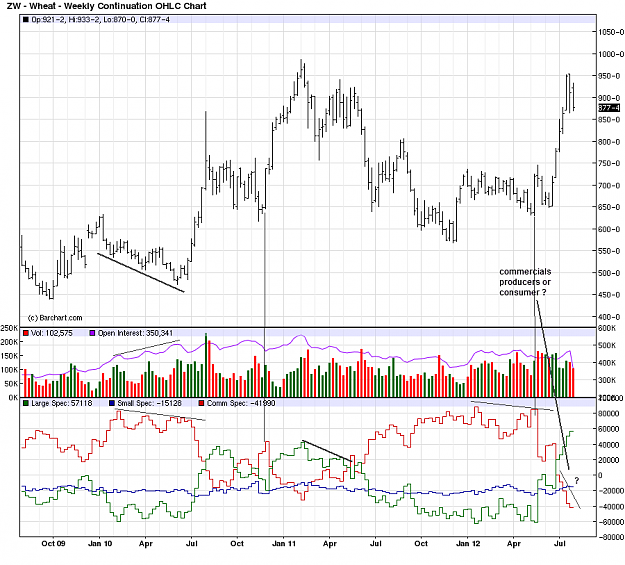
I don't get when about OI — Oi drop and commercials longs so accordingly to L W Oi is the commercials interest about the market to go up or down. But sometimes the market starts to go down and comercials are net log what does it means ? Euro ...
Trading COT Report
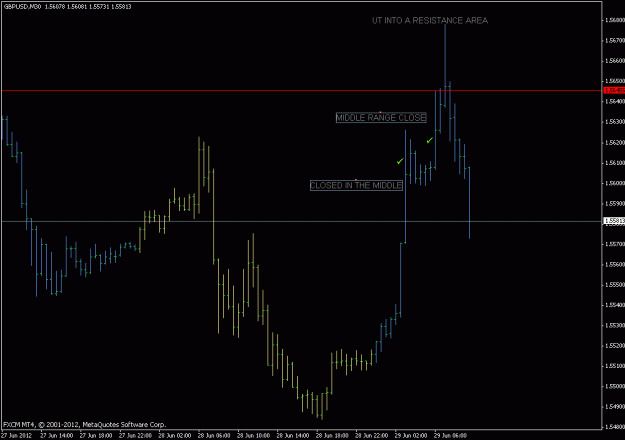
- Manekineko replied Jun 29, 2012
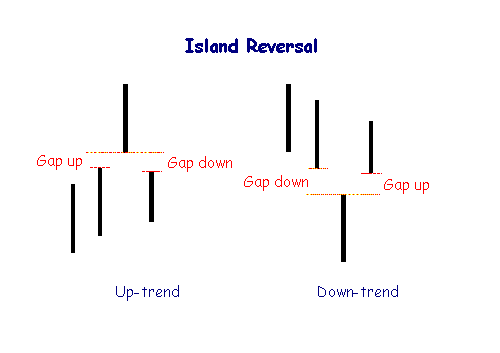
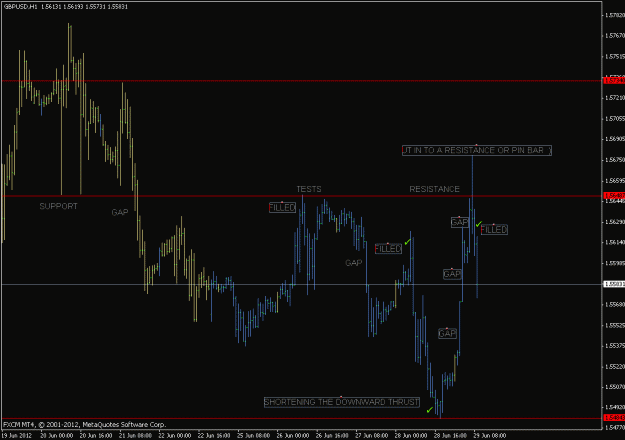
Liquidity gaps and UT in to a resistance — video !
No Brainer Trades
- Manekineko replied Jun 23, 2012
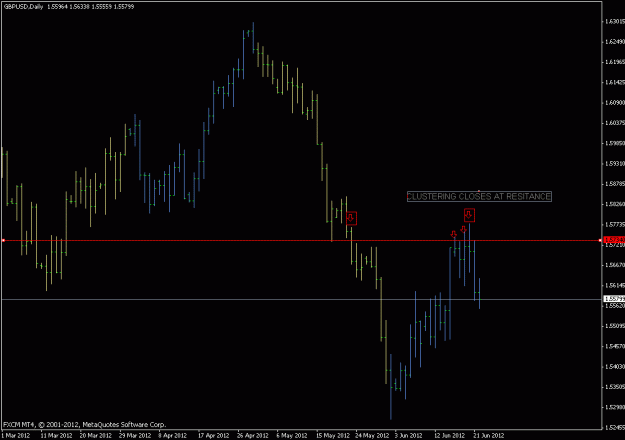
GBP/USD Daily is a shortening of the upward thurst. It means the market makes new higs but look at the closes. Are all in the middle of their ranges.
No Brainer Trades
- Manekineko replied Jun 23, 2012
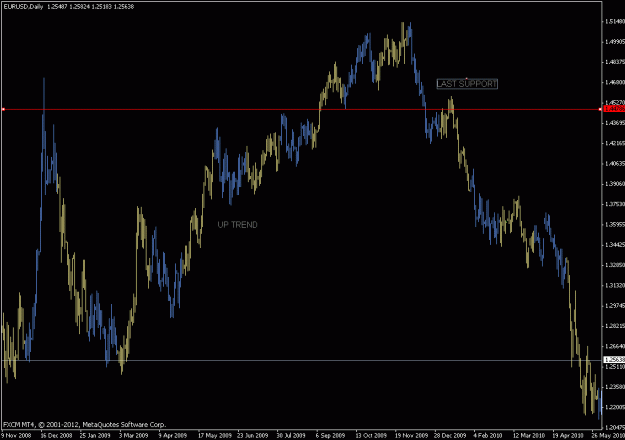
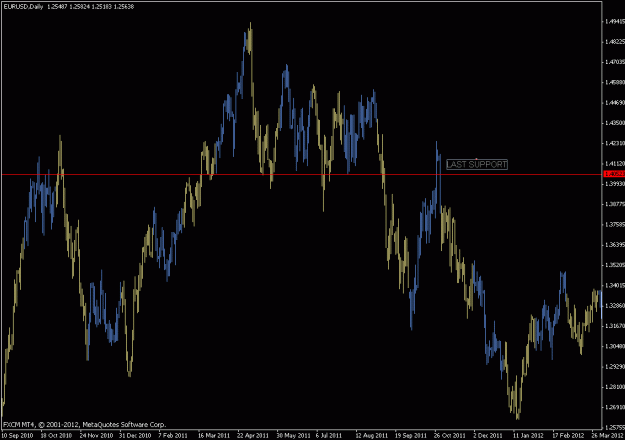
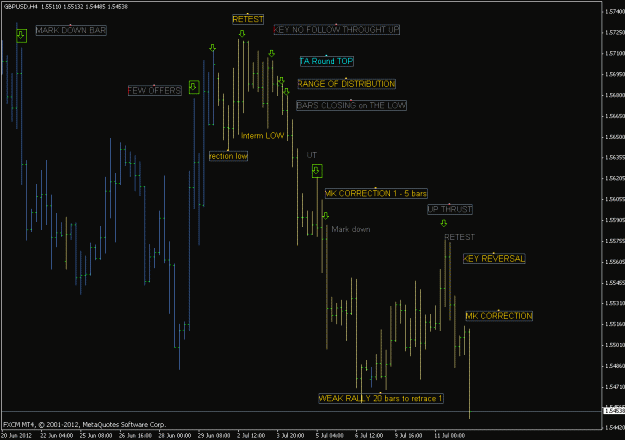
When the market forms a trading range of distribution after selling. When the latest point of support is taken out by the retracement. ( It means the market is very weak because it can't go above the support now resistance) Normally in the range of ...
When retracement has become a trend change?