- Search Forex Factory
- 36 Results
- Majd replied Oct 1, 2015
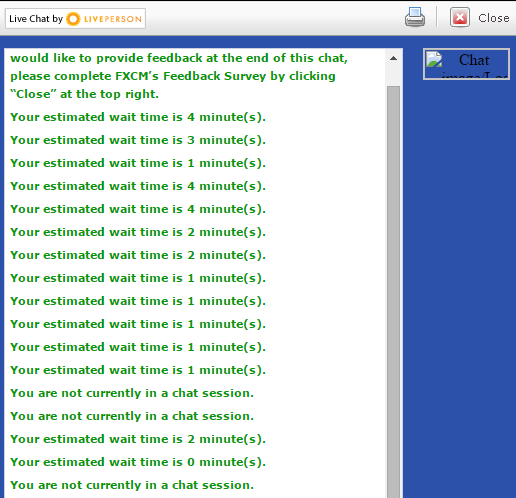
Look at their "live" chat! 15 mins and still waiting. such a joke
FXCM Passwords Hacked?

- Majd replied Oct 11, 2010
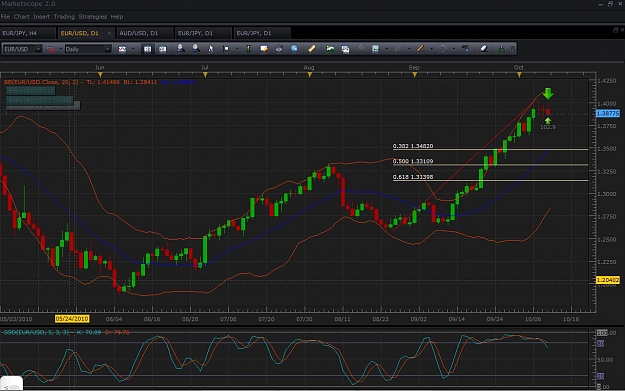
Closed a short with +102 pips. A shy shooting star on the daily with SS cross back after 2 daily Dojis; just took a second short but with tight SL. Let's see
EURUSD
- Majd replied Sep 20, 2007
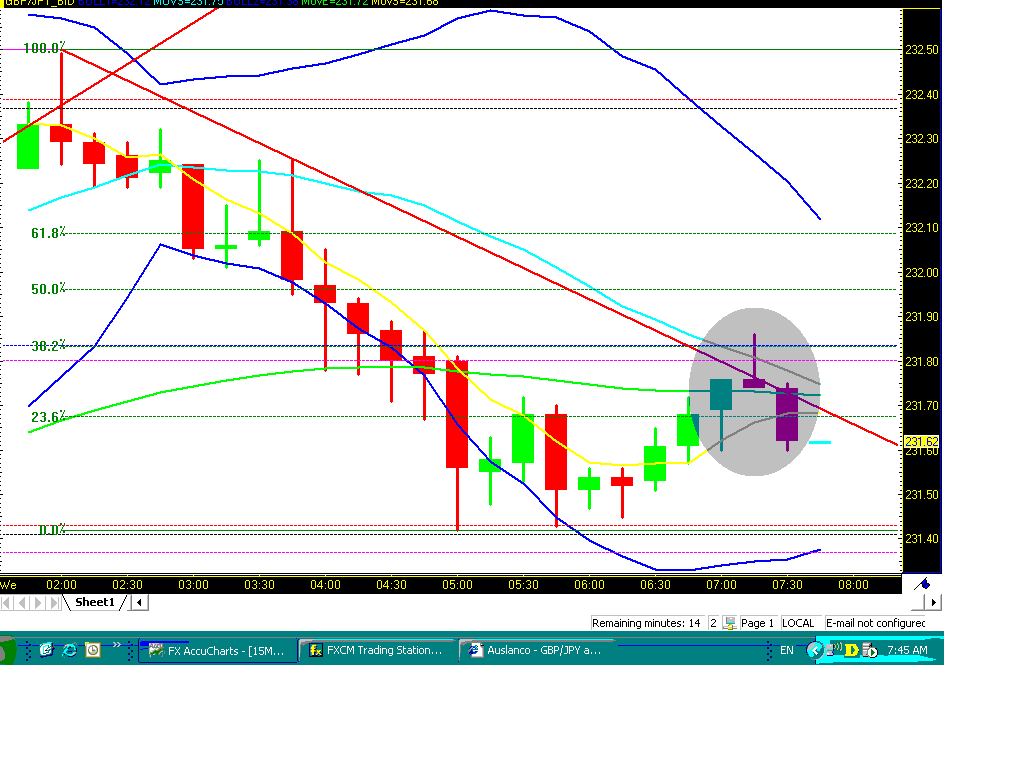
The support-Resistance on 15M: image
Auslanco - GBP/JPY and GBP/USD (newstrade)

- Majd replied Sep 11, 2007
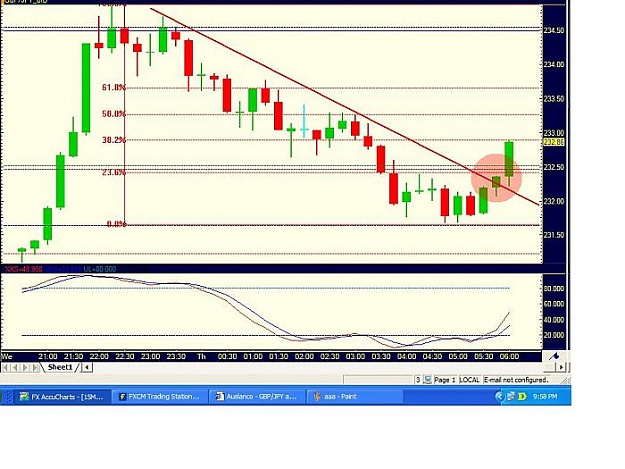
Potential retracement at the 15M: Gravestone candle confirmed by a following bearish one at the confluence of downward trendline, 38.2 and 20 SMA. image
Auslanco - GBP/JPY and GBP/USD (newstrade)
- Majd replied Sep 9, 2007
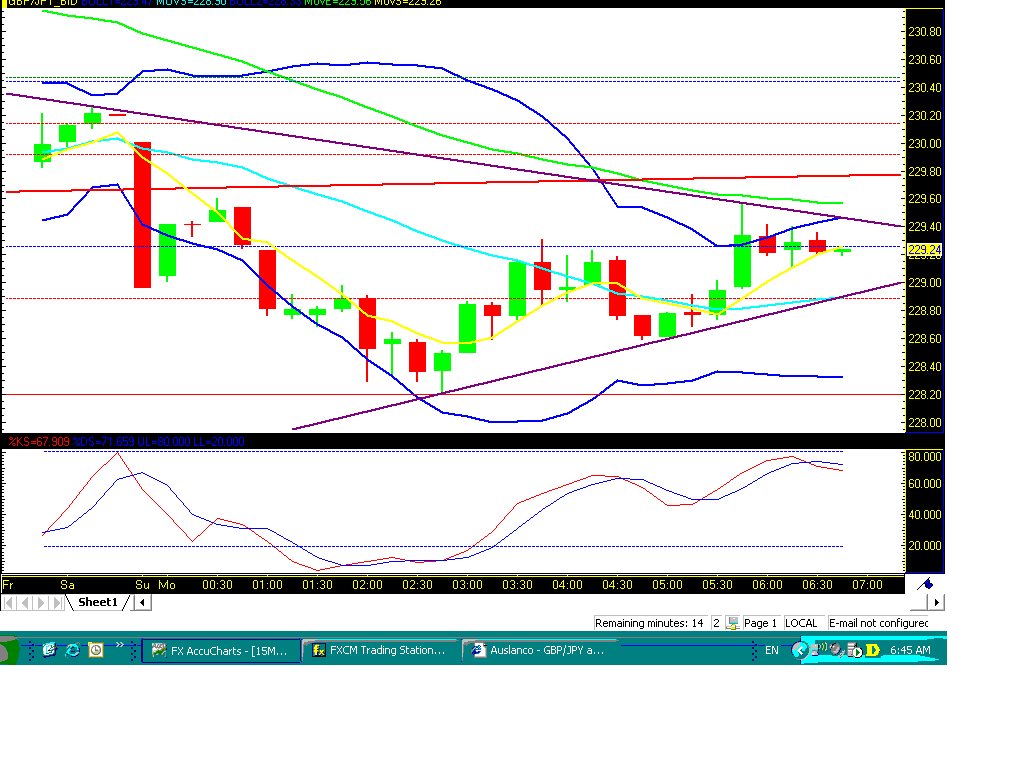
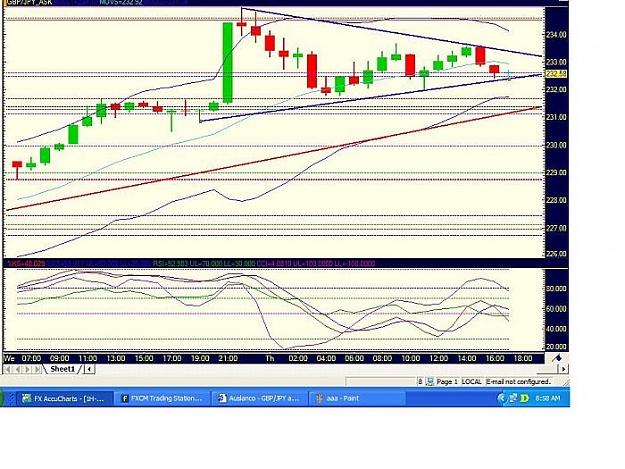
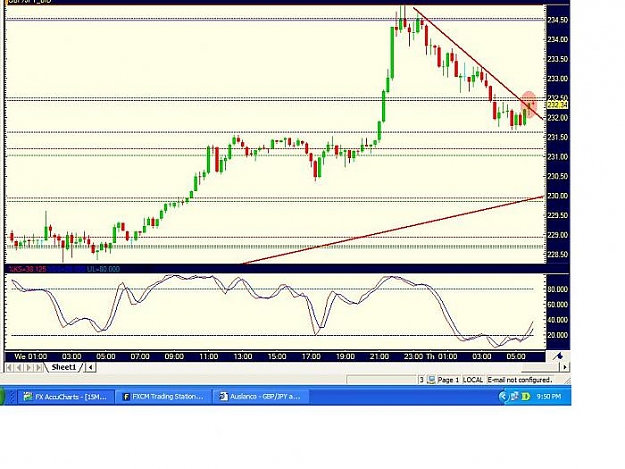
Symmetrical triangle on the 15M image
Auslanco - GBP/JPY and GBP/USD (newstrade)
- Majd replied Sep 9, 2007
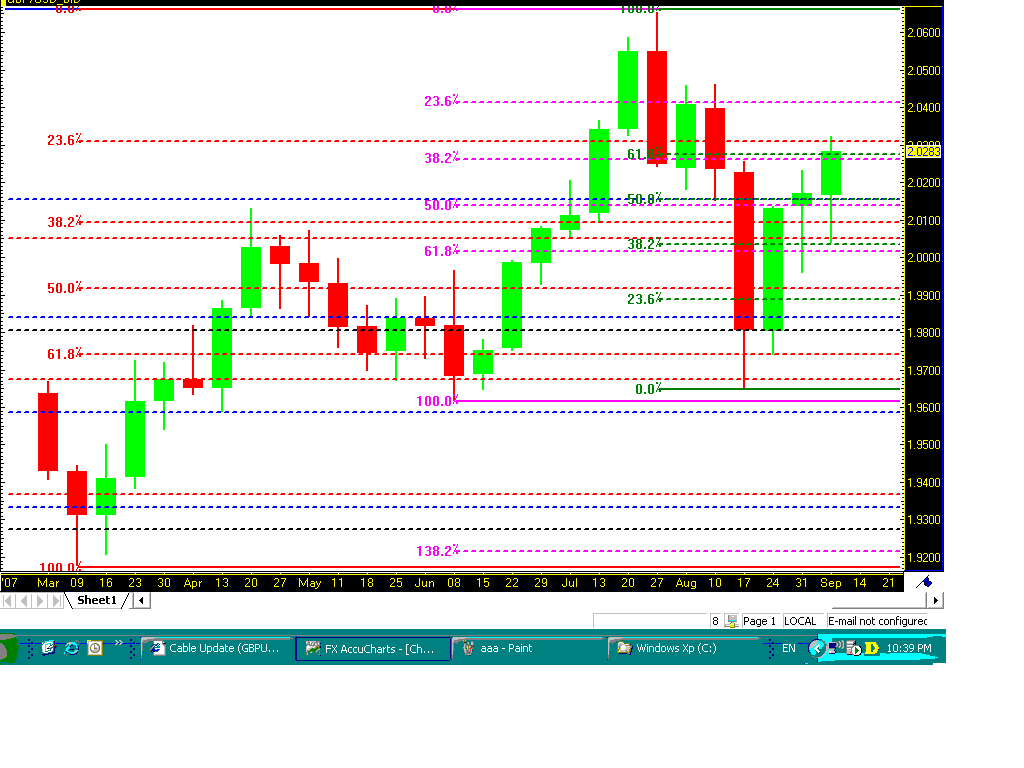
Weekly Fibos — Price just retraced from the 23.6 back to sit just above the confluence of 61.8 and 38.2: Up: Further upward movement would take us to the 23.6 @ 20415 Down: A retracement would take us to the confluence of two 50 Fibos and 23.6 ...
Cable Update (GBPUSD)
- Majd replied Sep 9, 2007
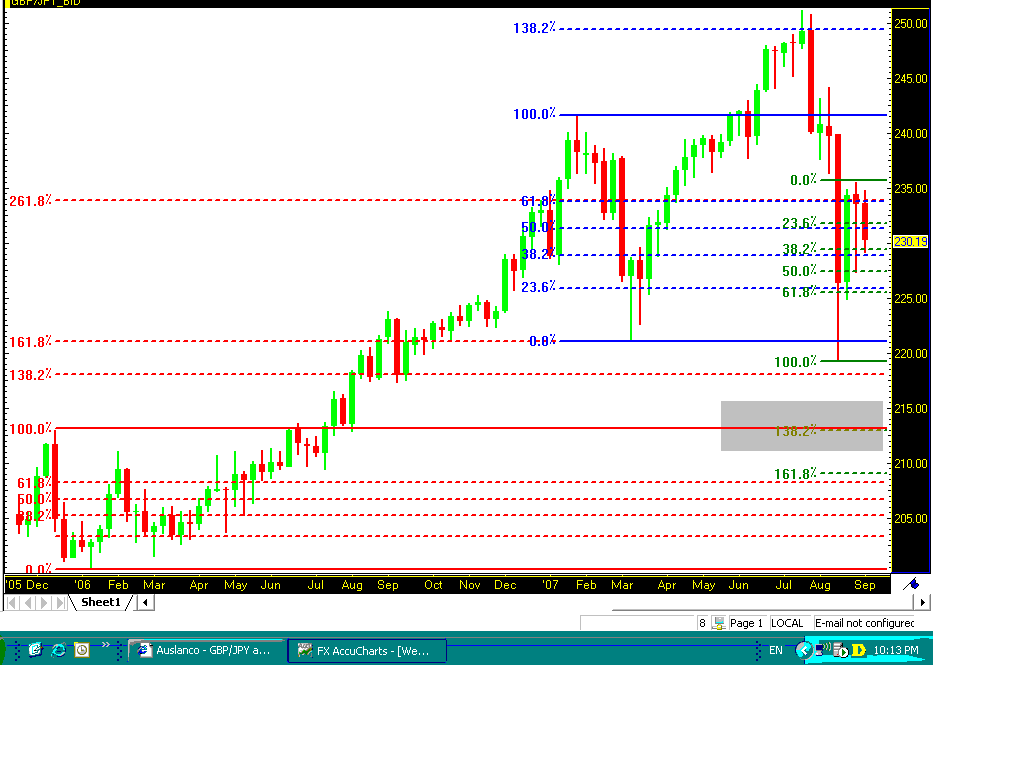
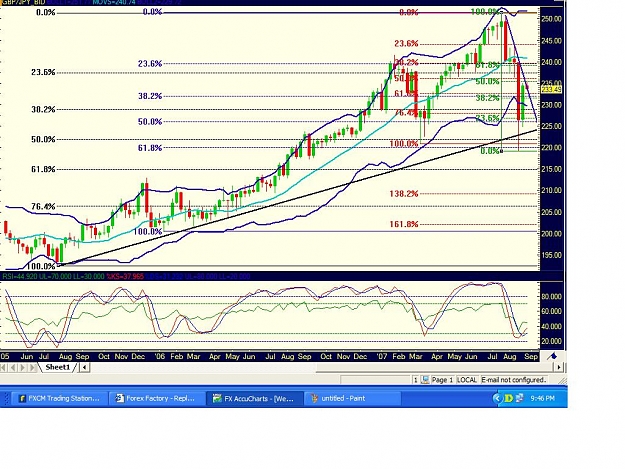
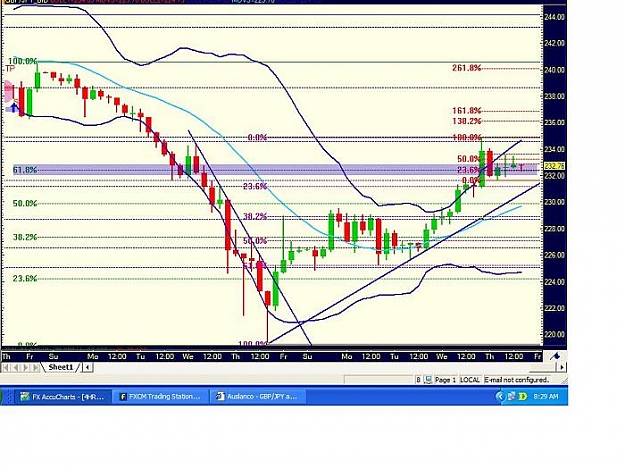
Weekly — The weekly Fibo extension: Next Fibo extension level of 138.2, as soon as the previous low is broken, is @ 213.07 image
Auslanco - GBP/JPY and GBP/USD (newstrade)
- Majd replied Sep 9, 2007
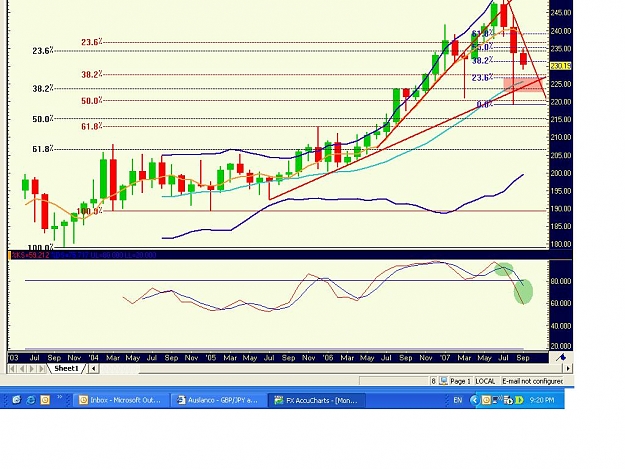
Monthly perspective — A quick look at the monthly: 1. Clear candle reversal pattern with almost a bearish engulfing candle 2. 5 SMA clear breaking and close below 3. 23.6 Fibo clearly broken 4. Stochs croosed over and back below the 80 OB ...
Auslanco - GBP/JPY and GBP/USD (newstrade)
- Majd replied Aug 31, 2007
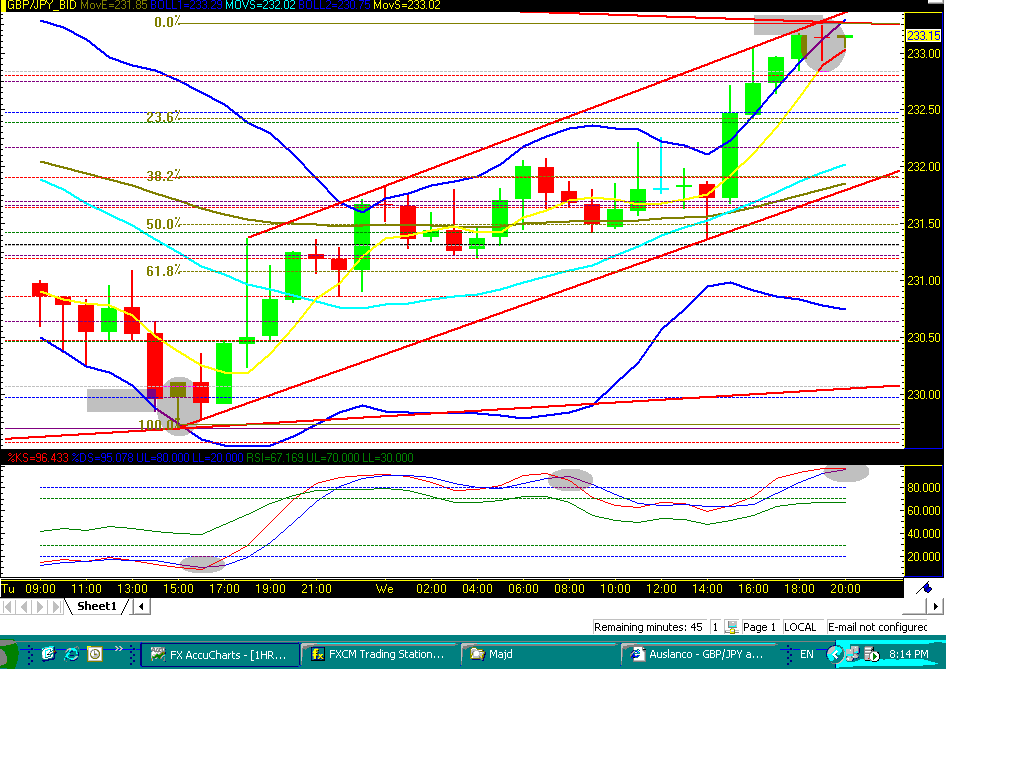
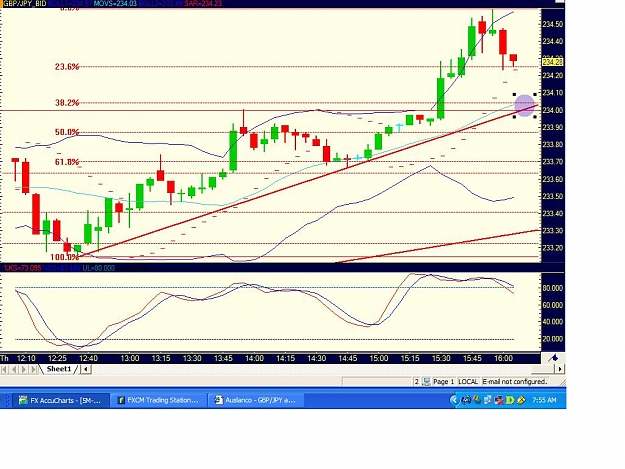
If 23.6 id broken, confluence of trend line, 38.2 of 5 Min and previous resistance @ 234.04, good potential retracement point image
Auslanco - GBP/JPY and GBP/USD (newstrade)
- Majd replied Aug 27, 2007
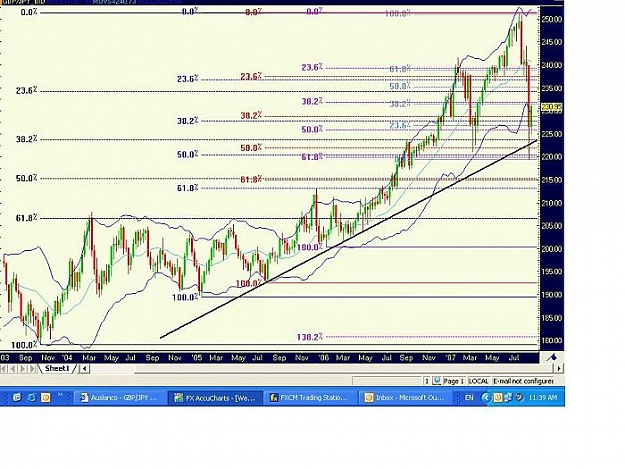
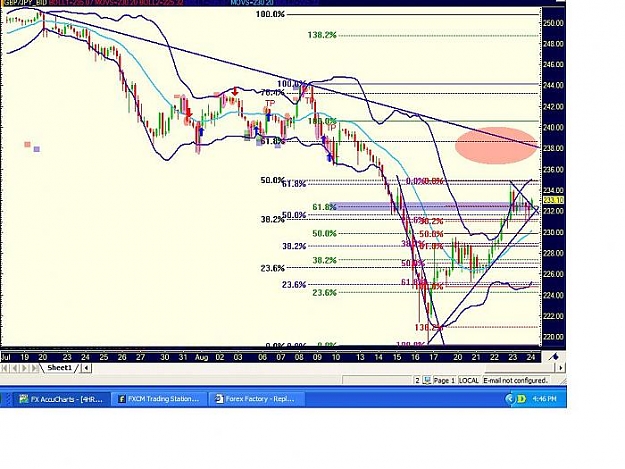
Actually, I would like to see it the other way on weekly, retracement off 61.8 and 50 Fibo back to close above upward trend line and currently testing the 50 Fibo in its way up again: image
Auslanco - GBP/JPY and GBP/USD (newstrade)
- Majd replied Aug 26, 2007
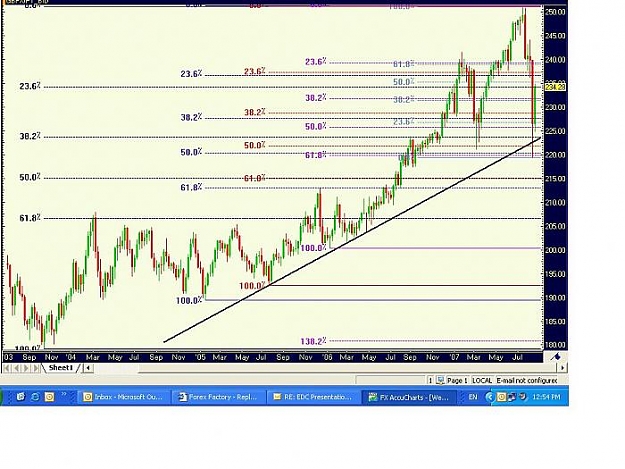
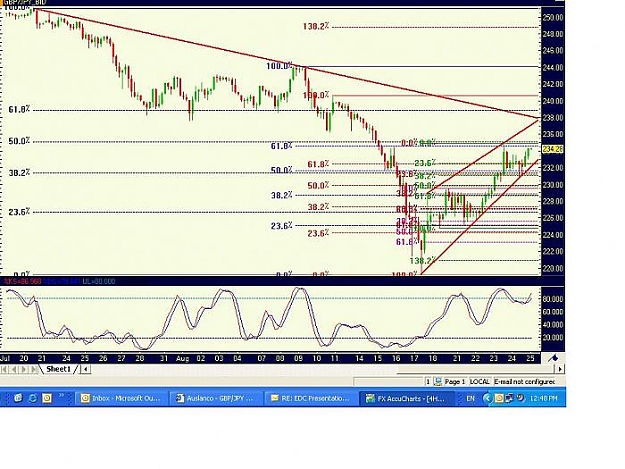
I am just wondering why lots of people are assuming that 219 will be revisited soon. IMHO, the weekly trend line still holds and we should expect previous highs of 240 next: image
Auslanco - GBP/JPY and GBP/USD (newstrade)
- Majd replied Aug 26, 2007
There is another resistance level just below 238.00 which is the resistance trend line that extends from the previous high @ 251: image
Auslanco - GBP/JPY and GBP/USD (newstrade)
- Majd replied Aug 24, 2007
I have a downward resistance line (extending from 19/7 high) that is currently @ 238.00 and would be at a lower once, if this level is reached; what makes you think that the 61.8 @ 238.80 could be reached? image
Auslanco - GBP/JPY and GBP/USD (newstrade)
- Majd replied Aug 24, 2007
Symmetrical triangle on the hourly: image
Auslanco - GBP/JPY and GBP/USD (newstrade)
- Majd replied Aug 24, 2007
Blue Fibo confluence rectangle: image
Auslanco - GBP/JPY and GBP/USD (newstrade)
- Majd replied Aug 23, 2007
Possible resistance levels: image
Auslanco - GBP/JPY and GBP/USD (newstrade)
- Majd replied Aug 23, 2007
On which bases are you assuming that? IMHO, everything is pointing up. Take a look at the weekly: - Upward TL extending for the last couple of years - Nice retracement off the 61.8 and 50 last week - This weeks candle is developing into a Bullish ...
Auslanco - GBP/JPY and GBP/USD (newstrade)