- Search Forex Factory
- 28 Results
-
 Hyena replied Apr 22, 2018
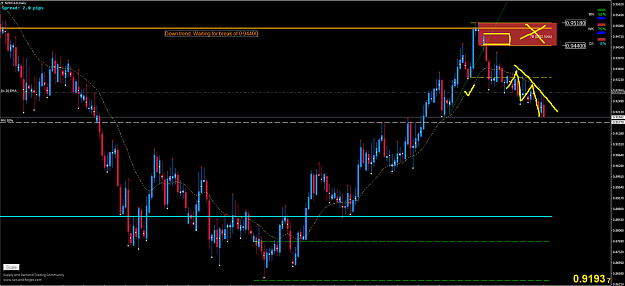
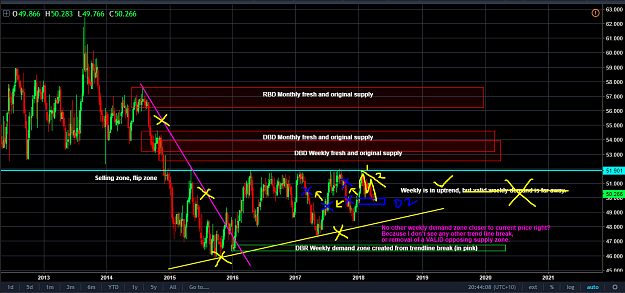
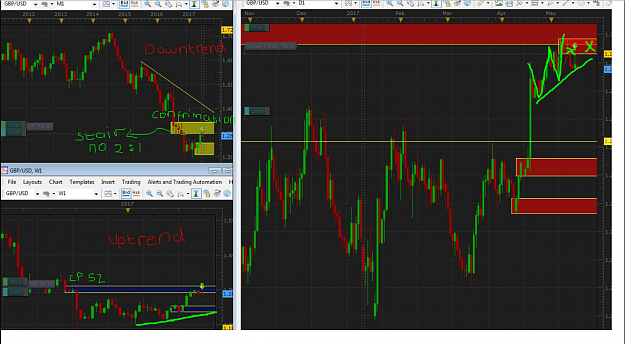
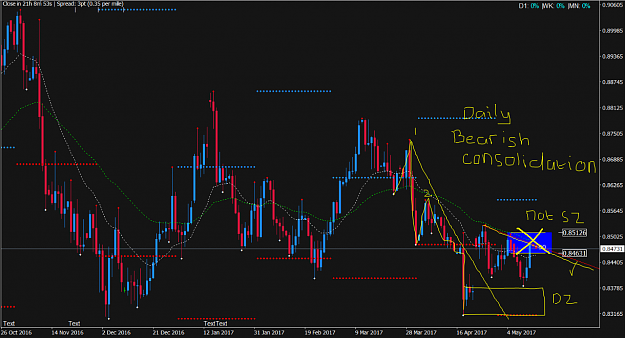
On daily chart, Descending Trendline you draw is incorrect.. Here.. image If Descending Trendline on daily chart is broken then short @weekly area of Supply as per the rules (horizontal blue)
Supply and demand in a nutshell by Alfonso Moreno
- Hyena replied Apr 10, 2018
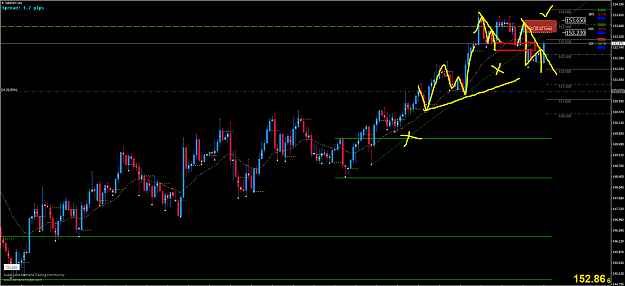
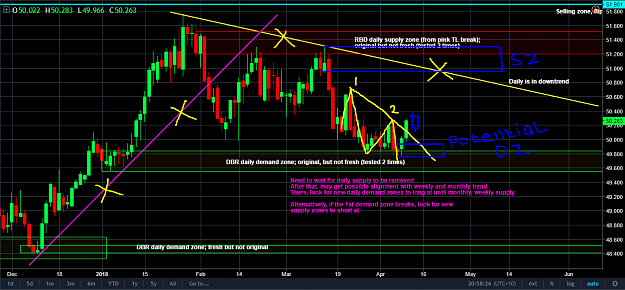
Daily image SHORT CAN HAPPEN AT THE DAILY AREA OF SUPPLY WITH CONFRIMATION TYPE OF TRADE BECAUSE NOW WEEKLY AREA OF DEMAND IS IN CONTROL, GOOD BASE STRONG IMBALANCE! BOOM!!!
Supply and demand in a nutshell by Alfonso Moreno CHEERS!
- Hyena replied Apr 10, 2018
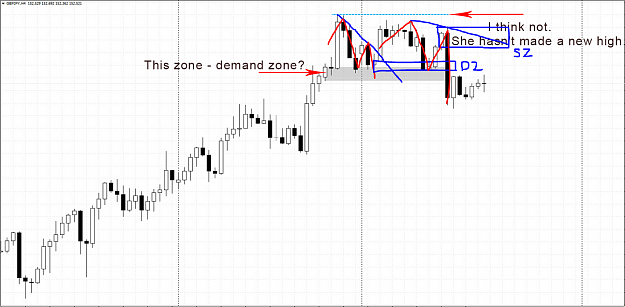
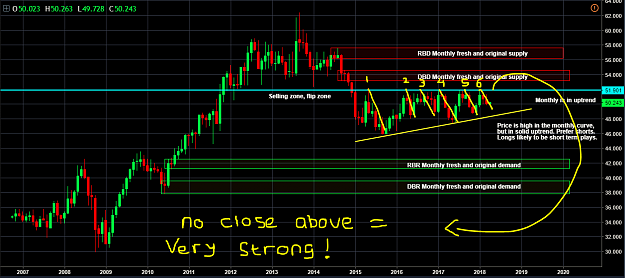
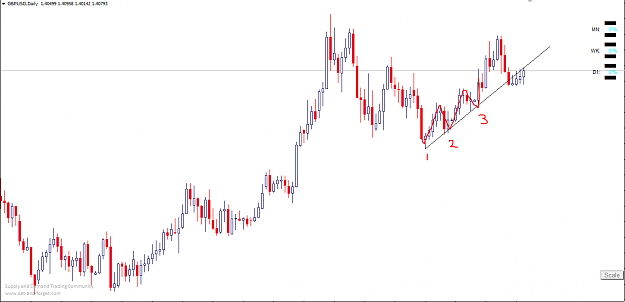
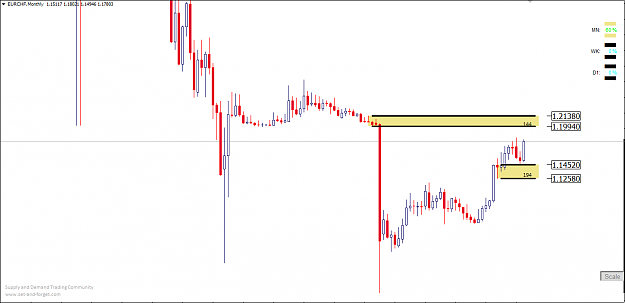
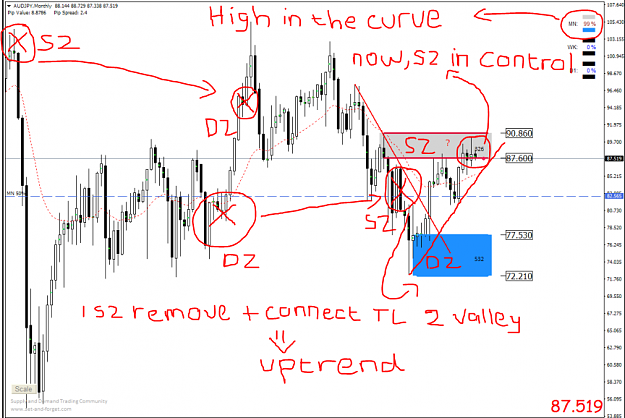
You'r welcome my friend.. First, let me read Price Action because it's very important.. Monthly image As you can see Price has pullback 6 times and always bounching from it, can't close above this zone/area. At point number 6 Price Drop and maybe ...
Supply and demand in a nutshell by Alfonso Moreno
- Hyena replied Apr 10, 2018
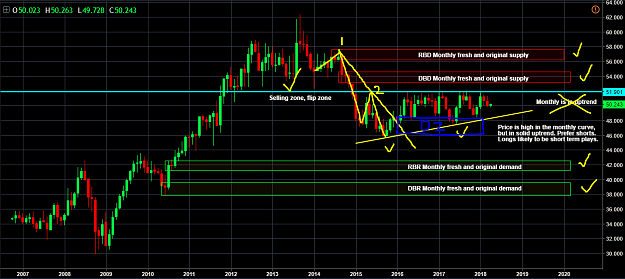
Hello Vishy, let me correct your chart... Monthly image After break an descending trendline point number 1 and 2 so, brand new area of demand has been formed as per the rules.. Monthly is in consolidation, not an uptrend, rule say : Uptrend IF 1 ...
Supply and demand in a nutshell by Alfonso Moreno
- Hyena replied Apr 4, 2018
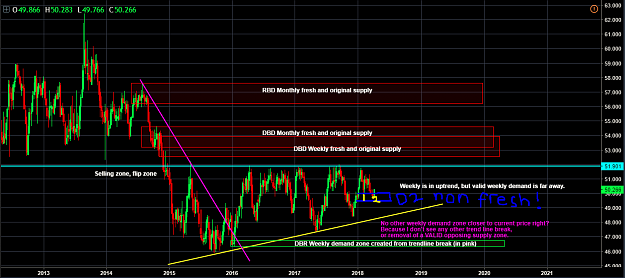
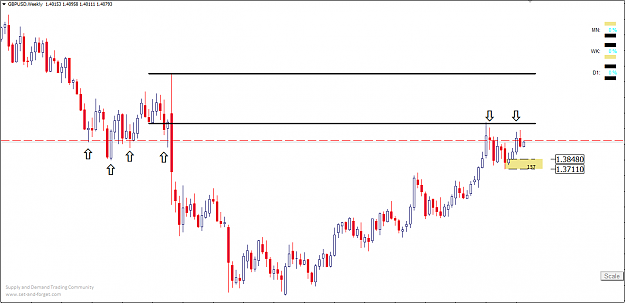
Hello you, before you take a trade ask yourself where the price is located, because location is the KEY to set and forget your trade...and always calculate the profit margin it's very important! Here's my chart on GBPUSD weekly TF : image Monthly ...
Supply and demand in a nutshell by Alfonso Moreno
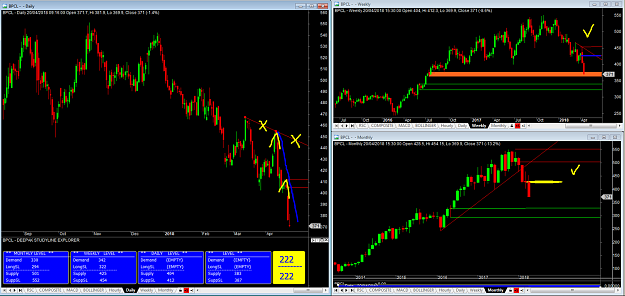
- Hyena replied Mar 28, 2018
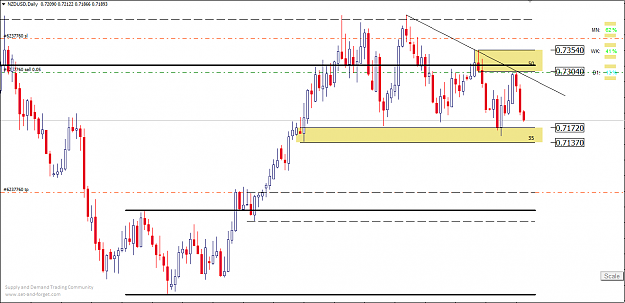
NZDUSD Daily SZ has been playing out Nicely! In an Downtrend SZ are respected, DZ are eliminated my target around 0.70200 at the Weekly area of Demand nested Monthly area of Demand image
Supply and demand in a nutshell by Alfonso Moreno
- Hyena replied Mar 28, 2018
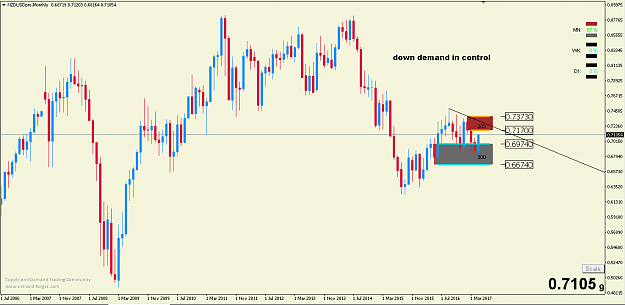
Now Monthly DZ is in control, price rallying strongly, SHORT NO LONGER ALLOWED! image
Supply and demand in a nutshell by Alfonso Moreno
- Hyena replied Nov 3, 2017
Hi T
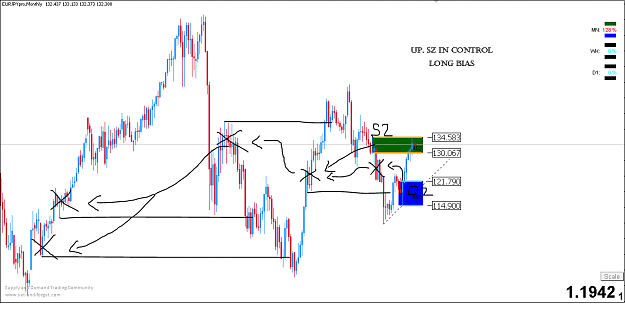
Supply and demand in a nutshell by Alfonso Moreno On my chart, EURJPY is UP, look this chart : image Read from the right Thanks
- Hyena replied Oct 10, 2017
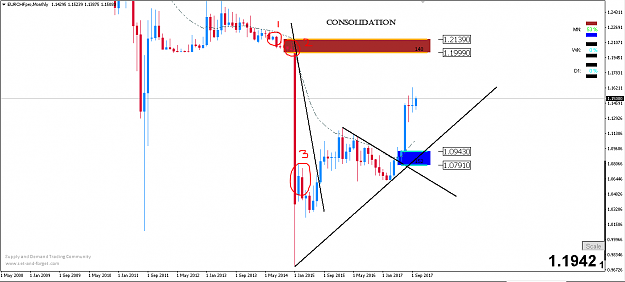
Alfonso, sorry i have question again, it's right consolidation EURCHF on the monthly?? and can i draw trendline like this after 3 CP?? Here's the EURCHF chart on the monthly : image Thanks.
Supply and demand in a nutshell by Alfonso Moreno
- Hyena replied Oct 10, 2017
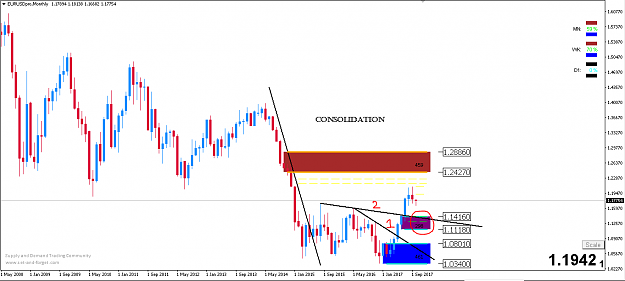
Alfonso, i have question, this is my chart on EURUSD : image The rules say, we connect the LAST 2 peaks to connect a descending trendline, so there it's no.1, brand new area of demand created after break descending trendline. My question is : If ...
Supply and demand in a nutshell by Alfonso Moreno
- Hyena replied Oct 9, 2017
Hello Autokon, i don't understand what do you mean, TL break just for FILTERING OUT THE LEVEL IN A MECHANICAL WAYS, on your chart AUDJPY descending TL break so, brand new area of demand created. If ascending TL break so, brand new area of supply ...
Supply and demand in a nutshell by Alfonso Moreno
- Hyena replied May 31, 2017
Here's Monthly chart on NZDUSD Monthly demand is in control so not allowed to go short on weekly,daily etc. image Cheers!
Supply and demand in a nutshell by Alfonso Moreno
- Hyena replied May 17, 2017
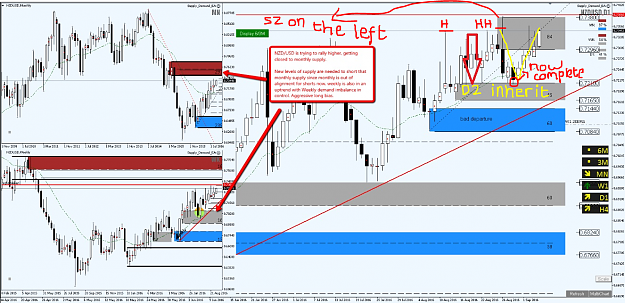
hello again Richie-Rees, see chart below : image on daily chart,you draw a trendline is incorrect, and it's not supply monthly downtrend sz is in control but bad structure there is stairs and no 2 : 1 imbalance, so we need confrimation (high in ...
Supply and demand in a nutshell by Alfonso Moreno
- Hyena replied May 17, 2017
Hello Nightrider45, maybe Alfonso is busy, so let me help you.. See chart below : image After price rallying make HH previous H and remove opposing SZ on the left, DZ inherit has been complete form.. Make sense to you Nightrider45 Cheers!
Supply and demand in a nutshell by Alfonso Moreno
- Hyena replied May 17, 2017
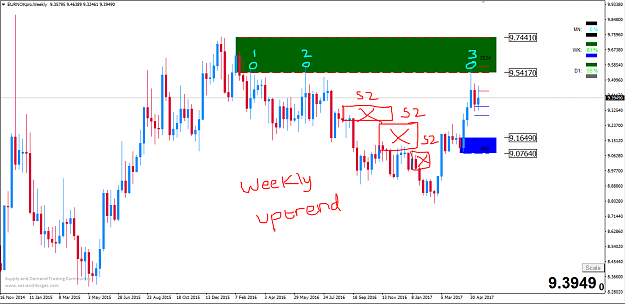
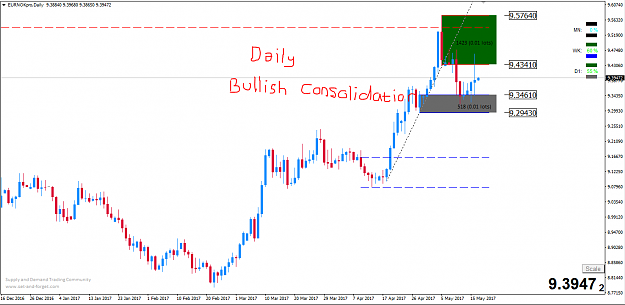
Rohule, where your chart weekly on EURNOK??ok no problem i can help you.. see chart below : Weekly image As you can see, Weekly is UPTREND and now weekly SZ is in control, so my question is, are we allowed to go long on daily DZ IF WEEKLY SZ IS IN ...
Supply and demand in a nutshell by Alfonso Moreno
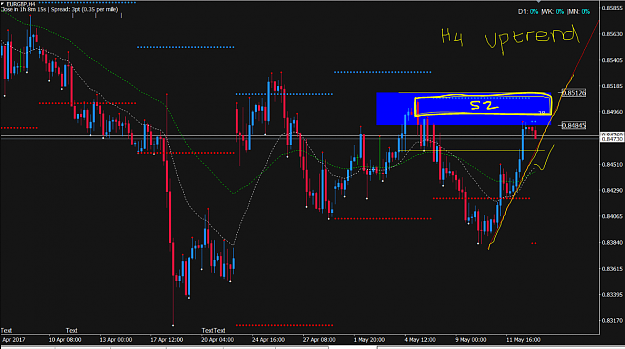
- Hyena replied May 16, 2017
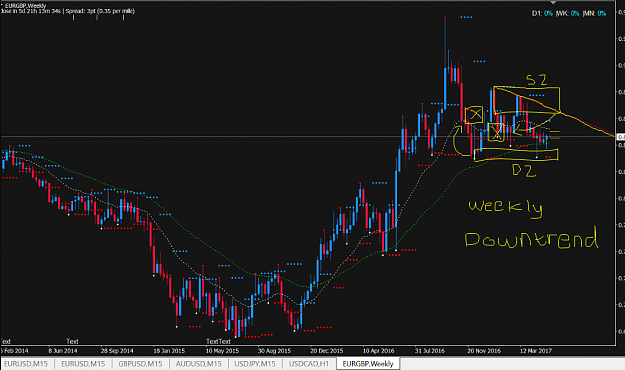
hello rohule,on your EURGBP swing trading configuration,SHORT BIAS for now why?because weekly is DOWNTREND! where you can put sell limit order?your top down analysis will tell you.. sorry i'am not swing trader,i'am position trader/longterm trader ...
Supply and demand in a nutshell by Alfonso Moreno
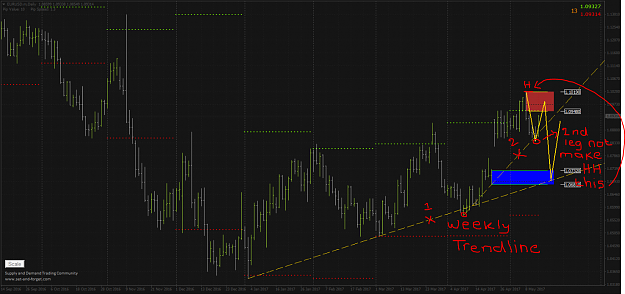
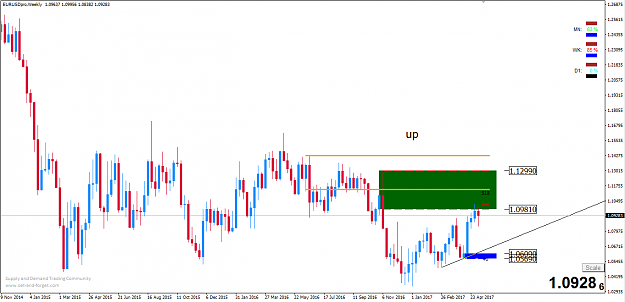
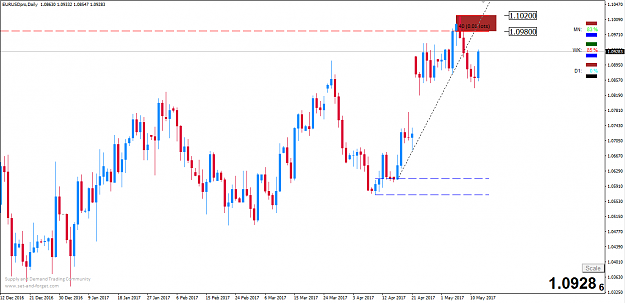
- Hyena replied May 13, 2017
Hi sonigl, let me explain to you.. Here's your chart : image Point no.1 it's not daily trendline, it's weekly trendline Point no.2 the 2nd leg needs make HH than H on the 1st leg to connect 2 valley See my chart : Weekly image Daily image ...
Supply and demand in a nutshell by Alfonso Moreno