- Search Forex Factory
- 20 Results
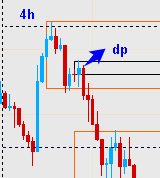
- Gxp1 replied Aug 11, 2014
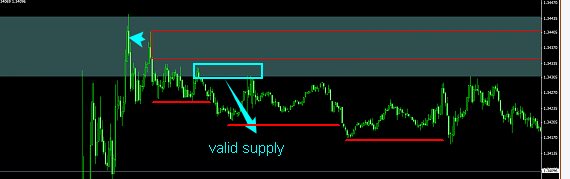
hi Winston, just wondering whether the 5 min supply (red box) is a reaction to the earlier zone (peak @10:30) as it failed to take the immediate demand out and the true supply would be the box i marked as it broke the support.But i may be wrong to ...
(binned per thread starter’s request) The Engulf Method
- Gxp1 replied Aug 8, 2014
hi fxyogi refering to your second chart, i interpret it differently, as shown and according to that it works-unless i am missing something
ReadtheMarket - Supply and Demand with Price Action
- Gxp1 replied Jun 23, 2014
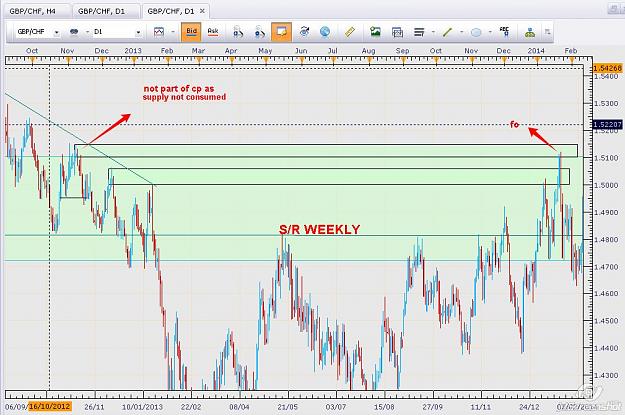
i may be wrong but also i would not have considered the third reaction from end of the cp line as part of cp as it remains unconsumed hence the reaction later on is understandably a FO.
ReadtheMarket - Supply and Demand with Price Action
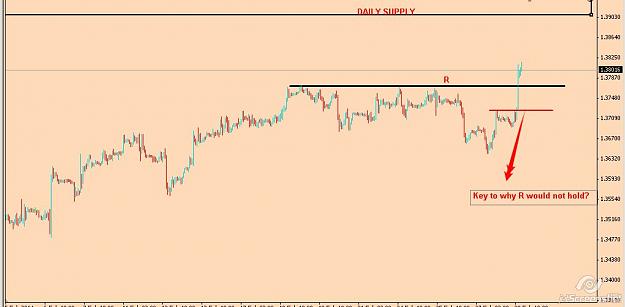
- Gxp1 replied May 9, 2014
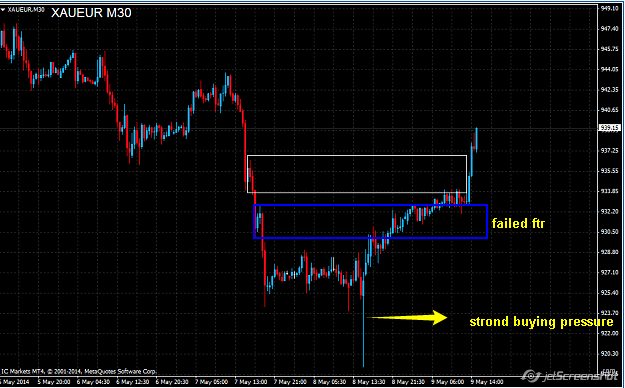
hi kumaramy, i know you have asked IF but if i may answer; 1.the FTR follwing the one you marked failed 2.strong buying pressure at the base these two factors would throw caution however i suppose many mortals would have also shorted at that FTR ...
ReadtheMarket - Supply and Demand with Price Action
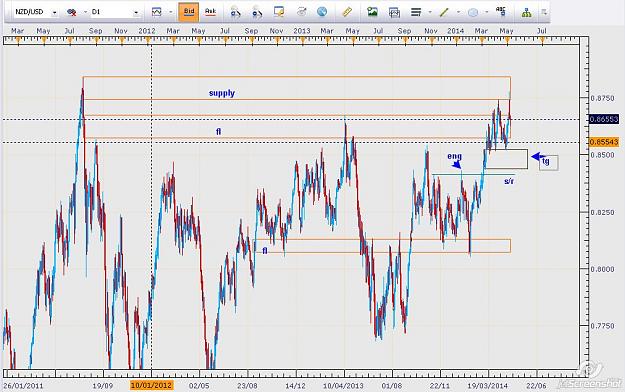
- Gxp1 replied May 8, 2014
hi IF, just to understand your thought process; you took the supply level (sharp departure) formed on 01/08/11 on the 4h chart (this is as far back my platform allows) you identified the DP and placed a limit order is your target the FTR (although ...
ReadtheMarket - Supply and Demand with Price Action
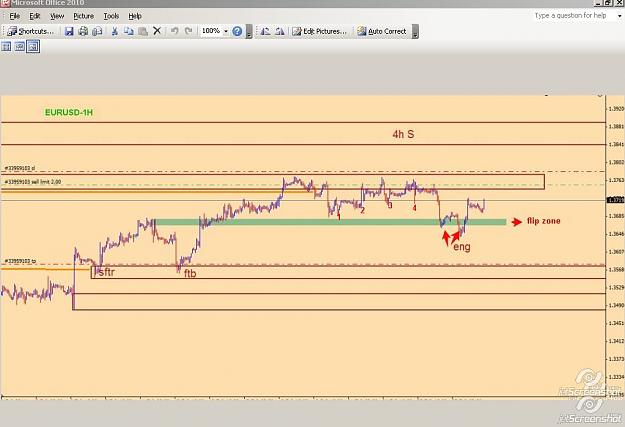
- Gxp1 replied Feb 28, 2014
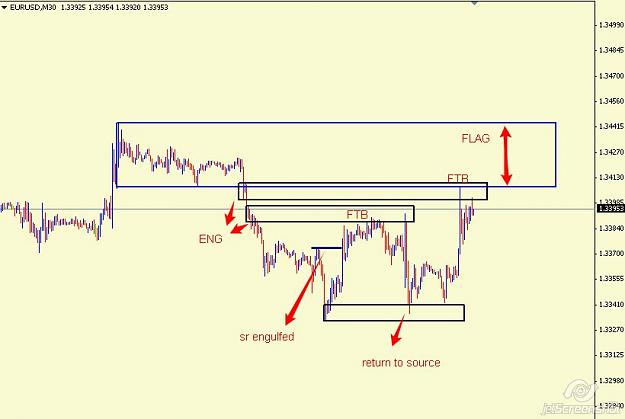
hi just to get the back into SD i am posting my chart which is already in my RTM journal I am presenting a 1 hr EU chart- this is a failed entry, i thought the level i was shorting will hold due to: 1. Engulfing of the flip zone below hence ...
ReadtheMarket - Supply and Demand with Price Action
- Gxp1 replied Oct 14, 2013
Hi alphonso, i attach the weekly gbp chart and hope you or anyone can clarify some uncertainity. 1.is supply at point A not valid because it failed to take out the opposing demand level at C 2.B is valid supply (not fresh because reacting from CP) ...
Supply and demand in a nutshell by Alfonso Moreno

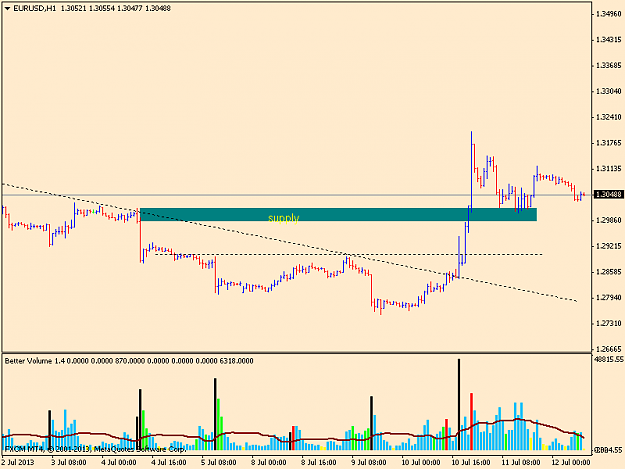
- Gxp1 replied Oct 8, 2013
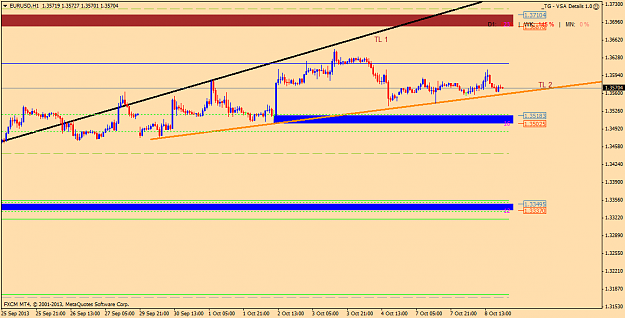
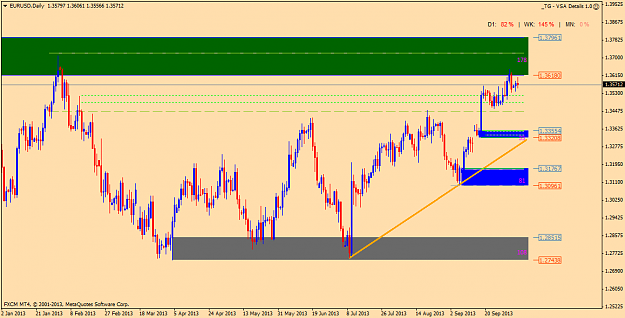
Hi Alphonso or anybody,i have a problem deciphering how to look at EUR; Daily- shows price level high on curve hence indicating to look for shorts Hourly-i have only shown immediate supply demand zones ,it shows price to break TL1 indicating to look ...
Supply and demand in a nutshell by Alfonso Moreno
- Gxp1 replied Sep 26, 2013
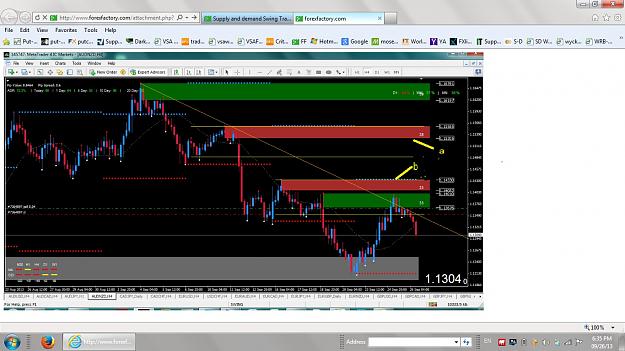
Hi alphonso, Whilst i know you have clear rules hence i shoulnt be questioning you but the your supply levels which i have labeled as a and b does not strictly comply: a- should not the level start from steep drop? b-the take away from the level is ...
Supply and demand in a nutshell by Alfonso Moreno
- Gxp1 replied Sep 17, 2013
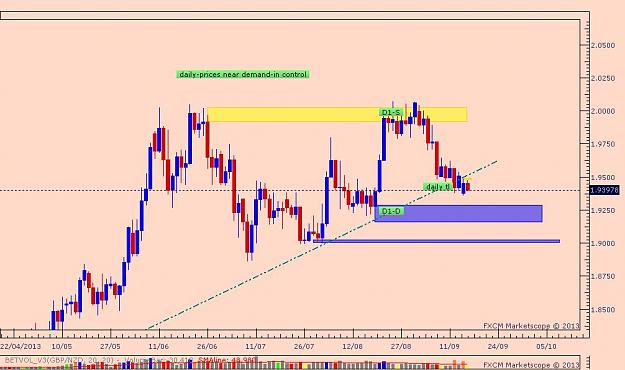
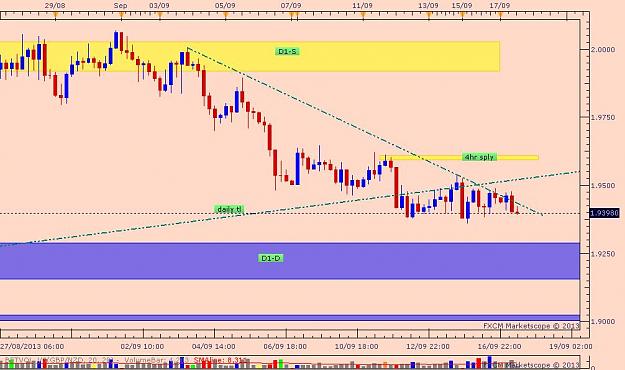
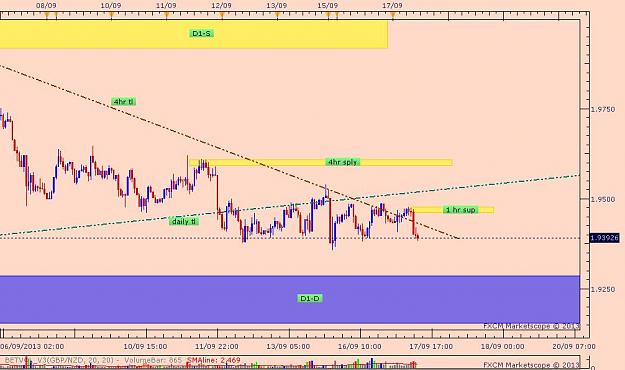
Trying to keep analysis simple-Alphonso's way (The platform is not MT4 so rectangle indicator not possible) I am looking to go long on GBP/NZD for these reasons: 1-Daily: the price level is near the daily demand and TL is up (demand in control) ...
Supply and demand in a nutshell by Alfonso Moreno
- Gxp1 replied Sep 11, 2013
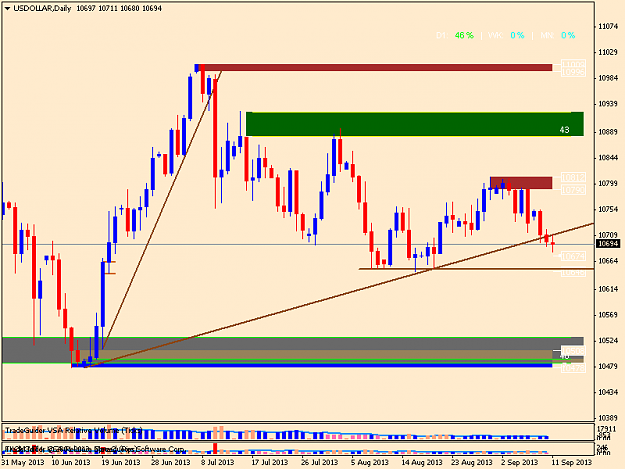
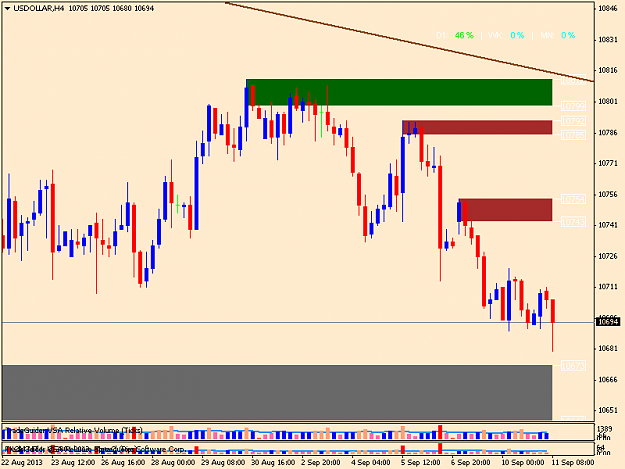
hi alphonso, in your assesment you check htf s/d levels and where the price is on the curve.You also mention the use of USD index to see where the pair is heading hence increasing the odds. I have attached the index chart which shows supply in ...
Supply and demand in a nutshell by Alfonso Moreno
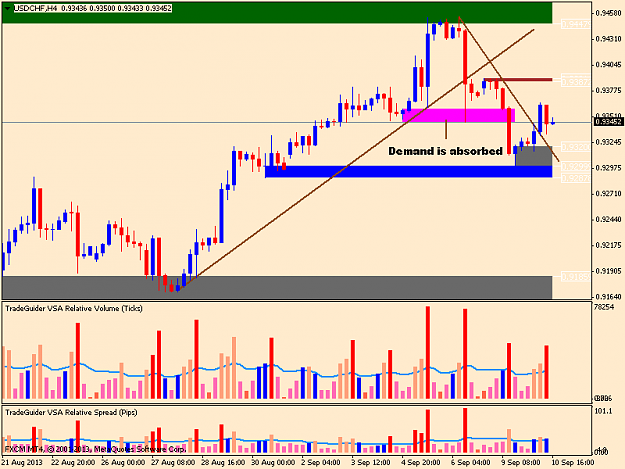
- Gxp1 replied Sep 10, 2013
Hi - The reason of supply still being dominant is that the last demand is being absorbed and the price is bit higher up in the curve so the turn of price from your demand level could be a reaction to the daily level.Anyway we will know what is the ...
Supply and demand in a nutshell by Alfonso Moreno
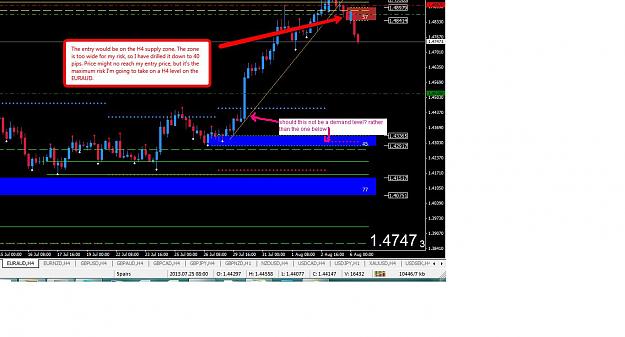
- Gxp1 replied Aug 6, 2013
Hi Alphonso, Just wondering why you chose the demand level 1.43369/1.42917 rather than the one above as i have indicated on your chart? please keep up the good work!
Supply and demand in a nutshell by Alfonso Moreno
- Gxp1 replied Jul 12, 2013
Since begining this new journey of SD trading i make a few observations. The placing of a limit order so that we can set and forget seems attractive at first but i think in terms of risk this is more than placing a market order which means looking ...
B.S. Trading with Kenneth Lee
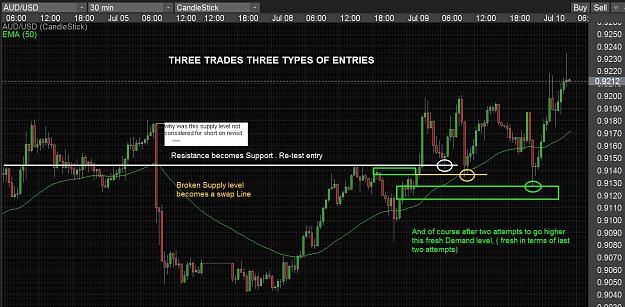
- Gxp1 replied Jul 10, 2013
Hi Kenneth, Thanks for the chart ,just wondering why the prominant supply level as i have indicated on the chart was not considered? as we can see it was later breached when the price revisited, is there anyway we could have figured that out? Thanks
B.S. Trading with Kenneth Lee
- Gxp1 replied Jul 9, 2013
Hi Thanks for the wonderful forum.I have been studying supply & demand for a couple of months and i feel comfortable with the concept. I am looking at a 4h USDCHF and have marked out major SD zone with also many in between .The uptrend pushes ...
B.S. Trading with Kenneth Lee

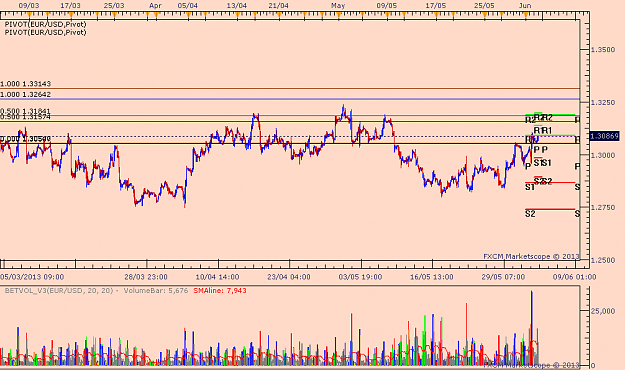
- Gxp1 replied Jun 4, 2013
Just as a matter of interst i plotted the 50% fibs on daily uhv bars ie 10 jan 13 & 25 feb 13 and we see a reaction at these zones on the hourly. It is a formidable resistance which should alert us to expect retracement
vsa with Malcolm
- Gxp1 replied Jan 4, 2013
I attach 1hr USD index chart, as can be seen its gone almost exponentially up. The last few bars are increasing on lower volume and possible correction(or reversal below) to previous high.In light of this would you tighten your stops?
vsa with Malcolm
- Gxp1 replied Nov 22, 2012
This is a 4hr eurjpy which i find puzzlling beacuse: 1.its uptrend approaching long term resistance 2.Lots of weakness observed during approach so i expect it to finally succumb but all the no demand and upthursts have failed,there is also a trap ...
vsa with Malcolm
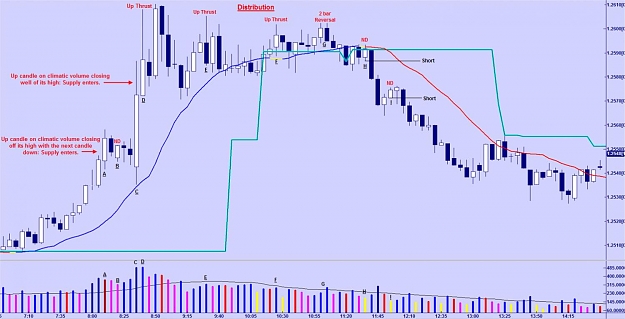
- Gxp1 replied Nov 6, 2012
Hi HiddenGap I was looking at some archives and i found this post.Please clarify why the bars D&f are upthurst and not simply "supply coming in" because i thought upthursts are one with high higher than previous bar and close near or at the ...
vsa with Malcolm
- Posts by Member Search: 'Gxp1'