- Search Forex Factory
- 170 Results (3 Threads , 167 Replies )
-
 EF5 replied Jun 22, 2020
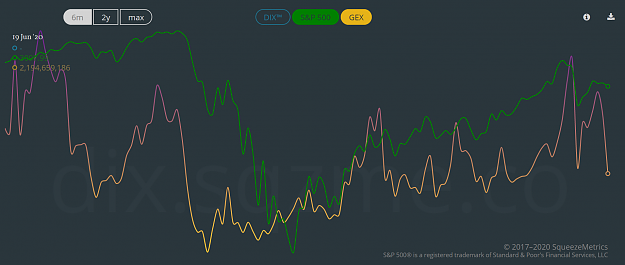
Friday's GEX number was much lower so a bigger move in equities is possible going into this week. image In case anyone isn't familiar with GEX it represents gamma exposure. Essentially, gamma exposure indicates the degree to which market makers ...
Private Island Traders
- EF5 replied Jun 18, 2020
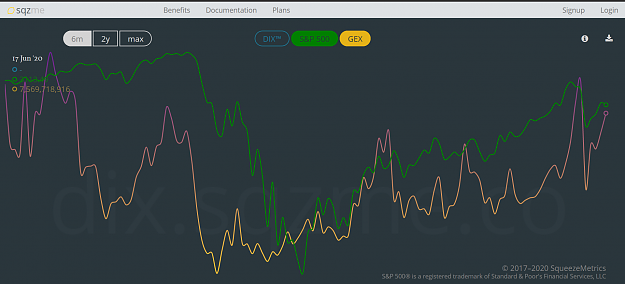
GEX is pretty high right now implying we probably won't get much price movement. It will be interesting to see where it stands after it updates tonight. image Perhaps more interesting is the alleged wave of pension fund selling coming into the ...
Private Island Traders
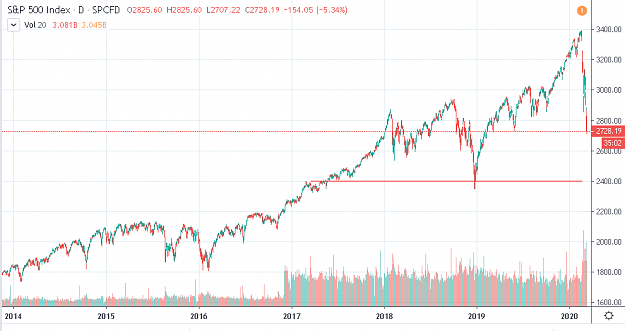
- EF5 replied Mar 16, 2020
When SPX broke 2,400 I was surprised to see we had an orderly sell-off down to 2,380ish. It used to be when major support like that broke you'd quickly cascade lower but that hasn't happened at all during this sell-off. Something is a little off ...
futuresNoptions trading - mostly indices/commodities
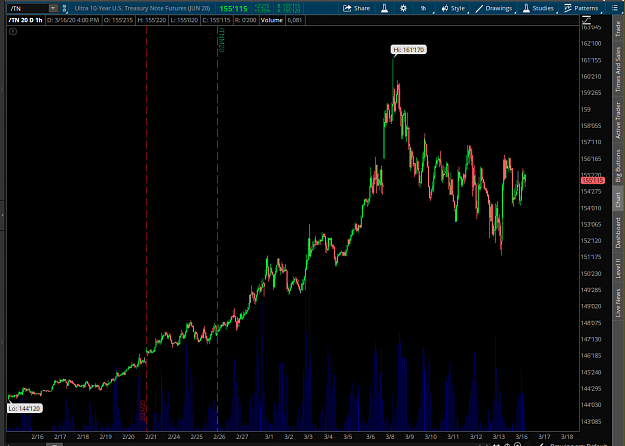
- EF5 replied Mar 16, 2020
Looks like 2,400 is about to be tested again... I think it breaks this time. image VIX currently at 77.
futuresNoptions trading - mostly indices/commodities
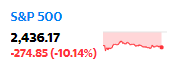
- EF5 replied Mar 12, 2020
Well, my 10% call was very close: image The Fed didn't cut but they did start what appears to be QE4.
futuresNoptions trading - mostly indices/commodities

- EF5 replied Mar 12, 2020
It turns out gold does go down during extreme market volatility. There's a 53.9% positive correlation between SPX and GLD when the VIX is over 40. Here's every instance of it: (You'll need to click into the image and then zoom in.) image This ...
futuresNoptions trading - mostly indices/commodities
- EF5 replied Mar 11, 2020
Why 2,300? There's decent support at 2,400: image
futuresNoptions trading - mostly indices/commodities
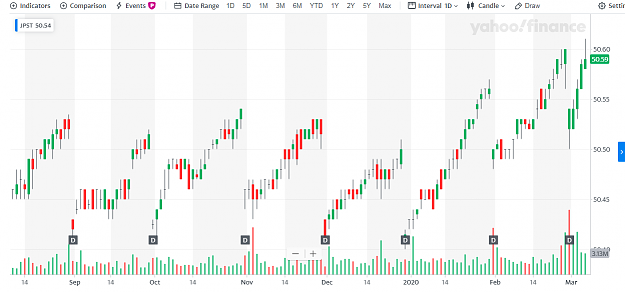
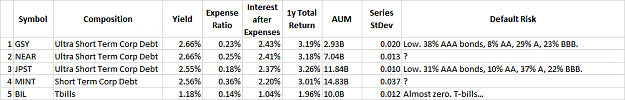
- EF5 replied Mar 5, 2020
Historically my favorite place to park cash has been in ultra short term corporate debt ETFs. This gives you yield with little default risk, and there's little price risk since its ultra short term debt so factors like inflation don't really matter ...
Idle Cash - Exploring the options...
- EF5 replied Mar 2, 2020
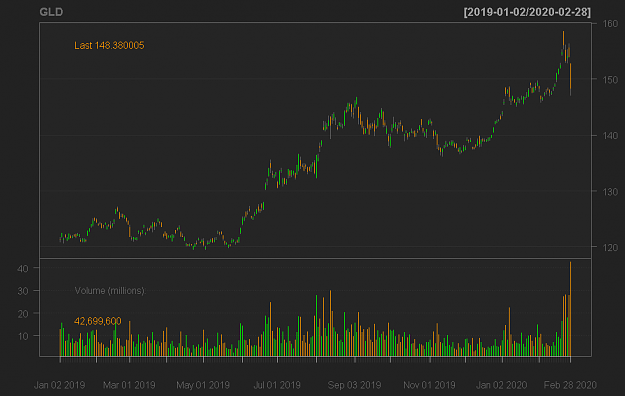
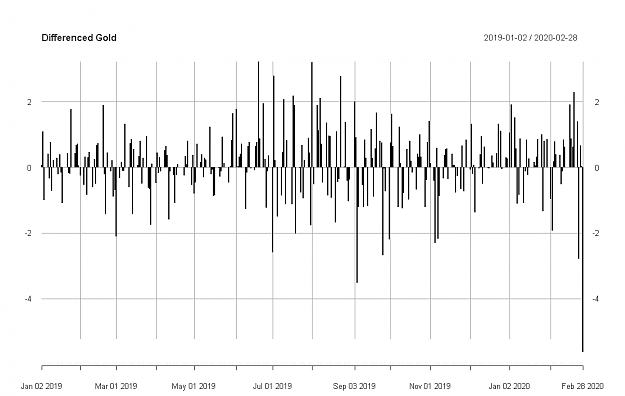
Regarding differencing to remove a trend, that's literally just looking at the difference between each observation. Here's an example: Gold prices image Differenced gold prices image Both are useful, but in very different ways.
Probabilities in a Random Walk (Question about one CP's post)
- EF5 replied Mar 2, 2020
Nope, I trade longer-term and go with the prevailing fundamentals. For me to buy a dip, I need it to meet the below criteria: Fundamentals support a bull market VIX > threshold (this time it was 40) Volatility indicator gives a buy signal #1 is the ...
Private Island Traders
- EF5 replied Feb 29, 2020
Thanks renNstimpy! I hold longer term and I've been getting bearish for a while so I'm not buying the dip this time... However, my volatility based indicator is giving a very strong buy signal: image
Private Island Traders
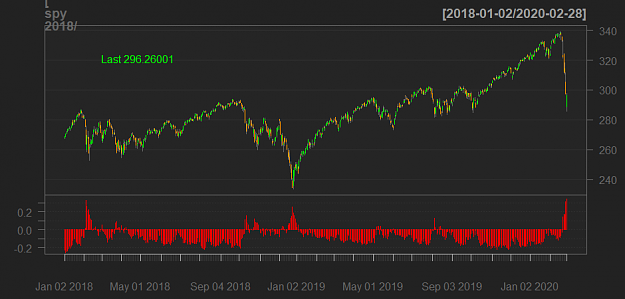
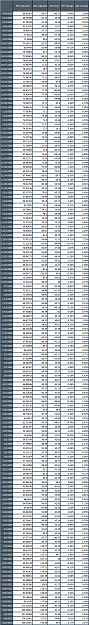
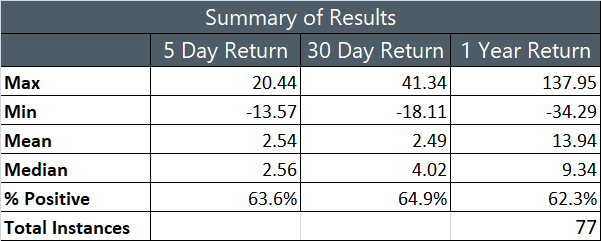
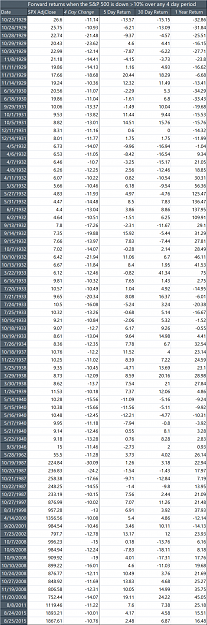
- EF5 replied Feb 28, 2020
The S&P 500 is down 10.76% over the past 4 trading days. Here's every instance since 1928 that the market has been down more than 10% in 4 days, along with corresponding 5 day, 30 day, and 1 year forward returns. (Click the image and zoom in.) ...
Private Island Traders
- EF5 replied Feb 26, 2020
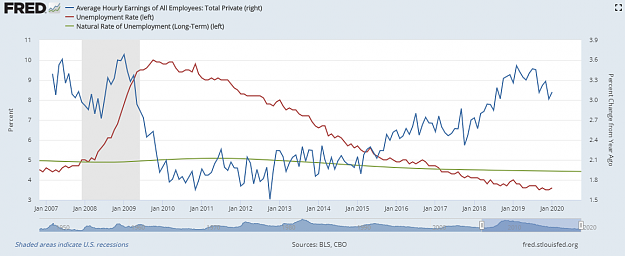
Sorry for the delay, I've needed sometime to think about what you wrote. My understanding is that in a closed economy higher real wages would have to be accompanied by a rise in productivity for it to help GDP. The thing that's puzzled me is the ...
Macro Talk
- EF5 replied Feb 25, 2020
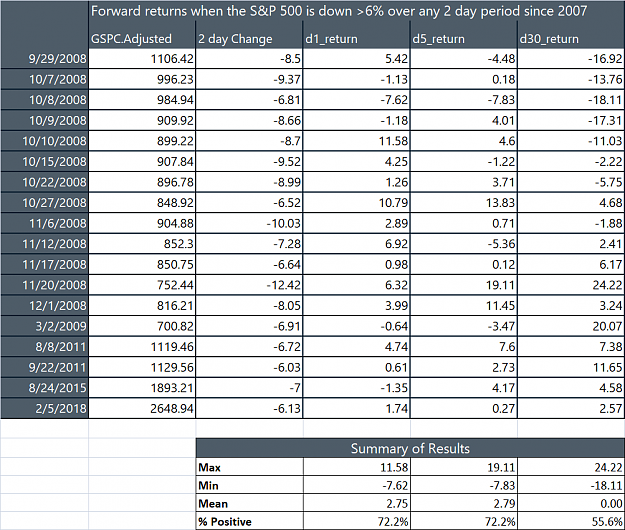
The S&P 500 is down 6.3% over the past two trading days. I did a study tonight to see how the market did going forward 1, 5, and 30 days when the market was down over 6% over any two day period since 2007. Here are the results: image Apparently ...
Private Island Traders
- EF5 replied Feb 24, 2020
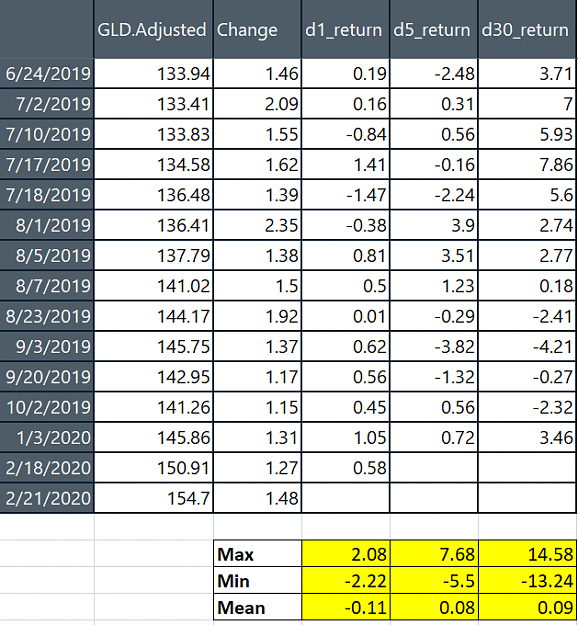
Currently gold is up 1.17% since Friday's close. I decided to do a quick study to see if gold advancing more than 1.1% in a day implied it would continue higher 1, 5 and 30 days into the future. As it turns out, big one day gains in gold DO NOT ...
XAU/USD & XAG/USD - Gold & Silver Traders Thread
- EF5 replied Feb 18, 2020
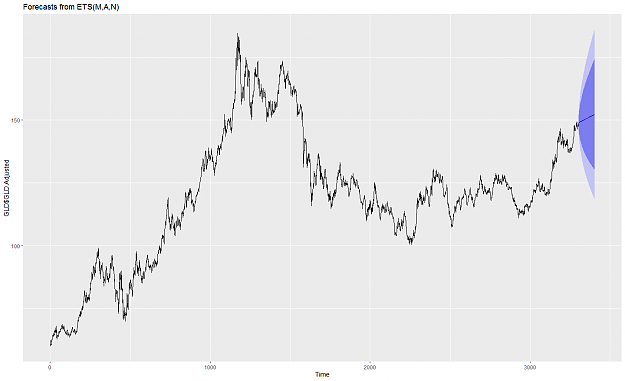
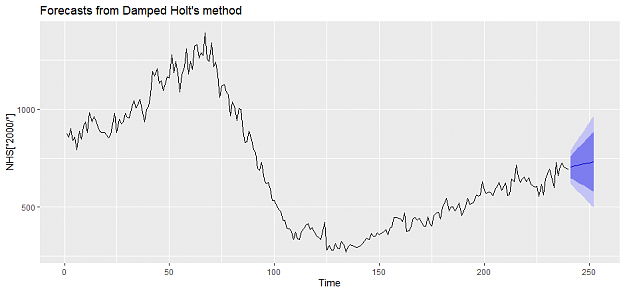
I'm playing around with forecasting in R and thought I'd see what I could come up with for metals. The function I used automatically creates a model based on factors like trend and seasonality. Here's what it's forecasting for the next 100 days in ...
XAU/USD & XAG/USD - Gold & Silver Traders Thread

- EF5 replied Feb 12, 2020
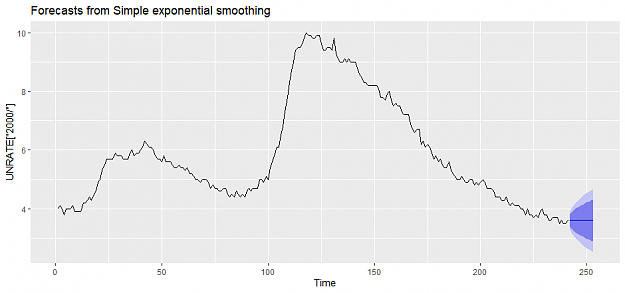
I was playing around with some forecasting functions in R tonight and made a quick forecast for the US Unemployment Rate using ses(): image The naive() function produces very similar results so I'll probably use both in the future. ...
Metals (data) Mining
- EF5 replied Feb 12, 2020
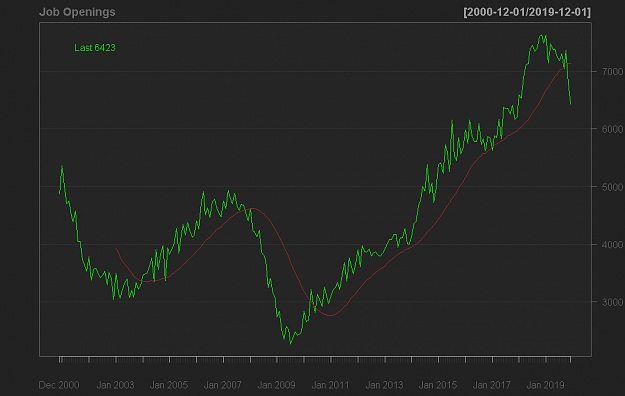
Job Openings were down sharply this month: image Historically it's got a pretty good track record as a leading indicator: image
Macro Talk

- EF5 replied Feb 10, 2020
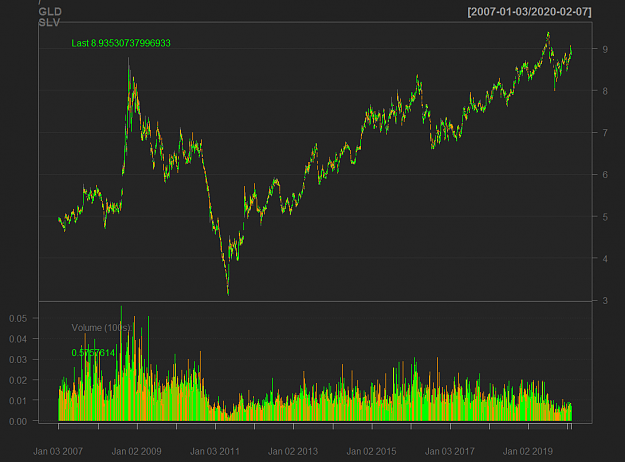
The Gold/Silver ratio is recovering nicely. It may hit a new high soon: image I think Silver is actually doing pretty well given the depressed industrial aspect from the coronavirus. image
XAU/USD & XAG/USD - Gold & Silver Traders Thread