- Search Forex Factory
- 9 Results
- Dupont replied Jul 6, 2010
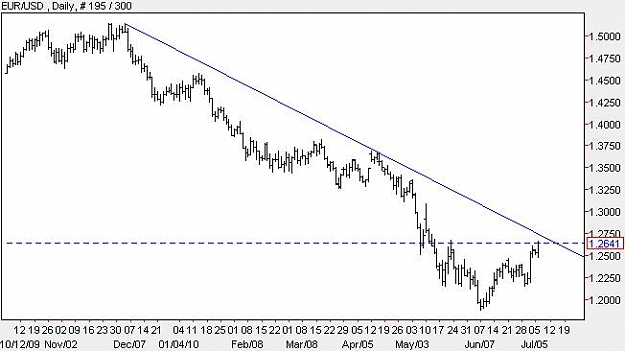
Same here, i quickly draw a chart, the resistance is in the 1.2700-1.2800 area: image
Trend Trading Chart Thread
- Dupont replied Jul 5, 2010
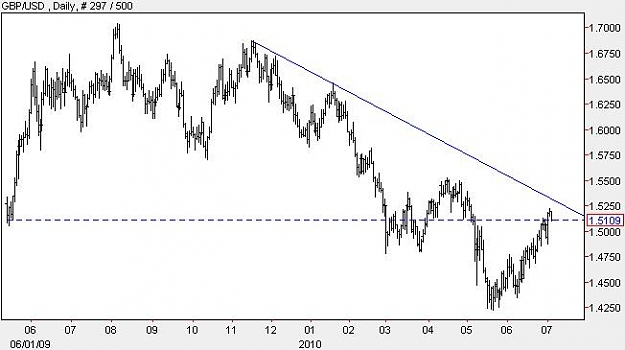
Hi DanUk ! Since you are playing the long term Jacko strategy on GBP/USD, i wanted to know if i got it right. If the market were to reach the resistance line this week, you are going to sell this market somewhere between 1.5300-1.5200, right? Here ...
DanUK Trend Trading Journal 2010
- Dupont replied May 3, 2010
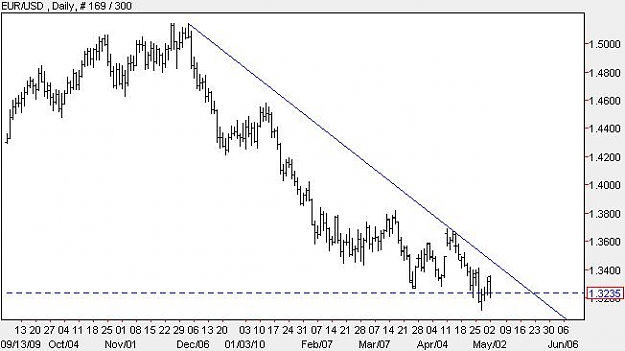
Next trade — Following Jacko's strategy, i drew a chart with the resistance line. I am actually looking for a short position (at the resistance line) which is currently around 1.3450.
Jacko's Forex House of Pleasure and Pain
- Dupont replied Apr 20, 2010
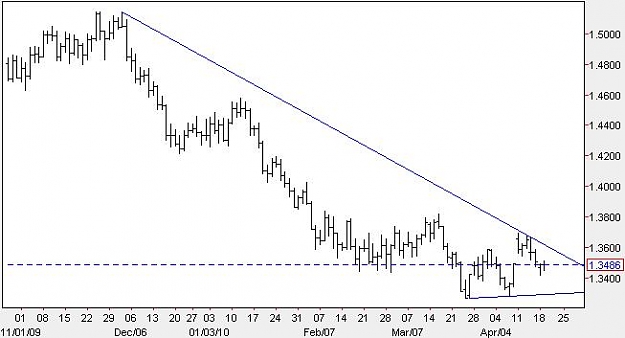
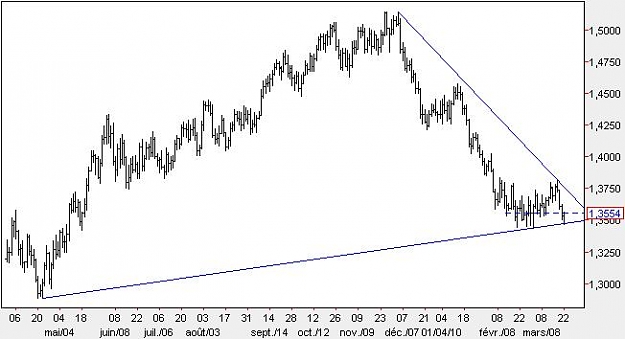
Yes, exactly. I drew this chart with the support/resistance lines. I see that the resistance is just above 1.3600. So the right thing to do, would be selling at 1.3600 with a stop loss at 1.3700. At least, that's what i intend to do (that is if the ...
Jacko's Forex House of Pleasure and Pain
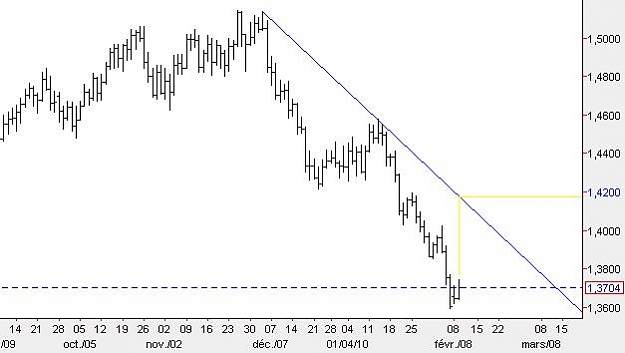
- Dupont replied Mar 22, 2010
Hi, I can't tell you why the target was exactly 1.3520. But, by linking the lowest points on a 300-bar-chart to draw the resistance line, i see that the resistance was around 1.3500. So, the 1.3520 should be because he wanted to be sure to close the ...
Jacko's Forex House of Pleasure and Pain
- Dupont replied Feb 9, 2010
I am also looking to sell at the resistance, currently at 1.4150-1.4200 (even though the price won't reach it today). But the resistance is getting down every day...
Jacko's Forex House of Pleasure and Pain
- Dupont replied Feb 5, 2010
Just look at the calendar: 8:30am USD Non-Farm Employment Change 8:30am USD Unemployment Rate
Hey, USD! What's happened??

- Dupont replied Dec 23, 2009
I saw that chart on another thread, but i don't remember which one, so...
Trading Posters
- Dupont replied Dec 7, 2009
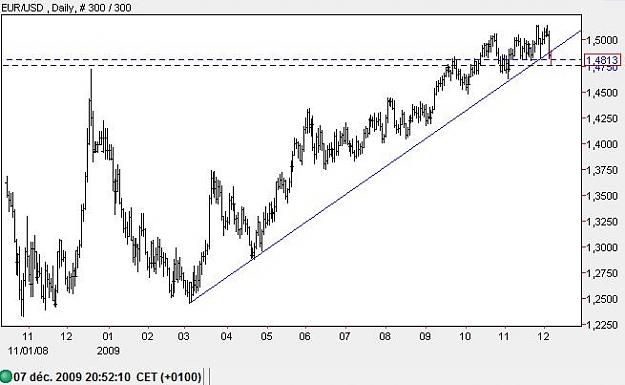
Looking at a 300bar long daily chart with last week resistance, i understand now that the trend is broken and is heading south right? (due to the break of the support line, and the up movement bouncing on it just afterward). So, if we are following ...
Jacko's Forex House of Pleasure and Pain
- Posts by Member Search: 'Dupont'