- Search Forex Factory
- 16 Results
-
 Daniel 777 replied Nov 29, 2016
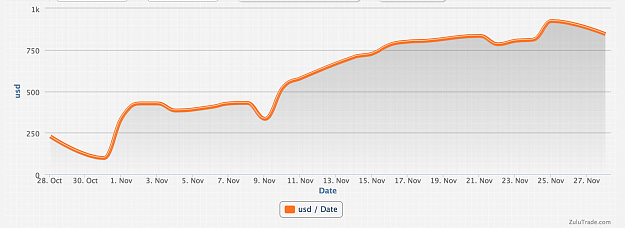
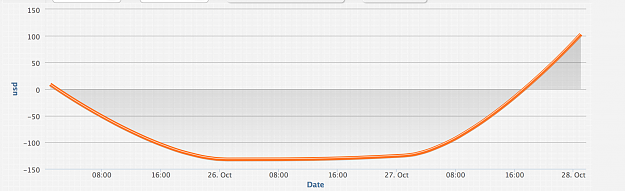
Equity Curve since start at the end of summer this year
Zulutrade signal providers using the TMS system
- Daniel 777 replied Nov 11, 2016
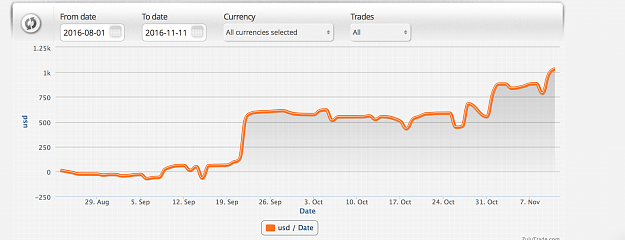
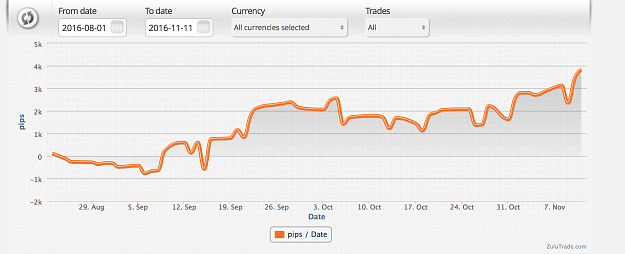
Dear Traders, Just wanted to say a big thank you to all who help on this thread. I wanted to share with you the results I have had after nearly 3 months of trading TDI. The results are roughly this - 56% winners, 10% increase in account and a few ...
Trading Made Simple
- Daniel 777 replied Oct 29, 2016
Hi Emmanuel , I have got building into a price retracement understood. I found the pdf on post #20,342 ( How to Build a Position taken out of the book title How to Beat the Forex Dealer by Agustin Silvani) that you shared very helpful. This makes a ...
Trading Made Simple

- Daniel 777 replied Oct 28, 2016
USD/JPY 104.75 AUD/USD 0.7625 I'm flat out of all my positions to close up 1.2 % for the week. Left some of my deeper EUR/NZD in as buy limits - closed out first position for 30 points.... My equity curve for the week ! Let's just say the week got ...
Trading Made Simple
- Daniel 777 replied Oct 27, 2016
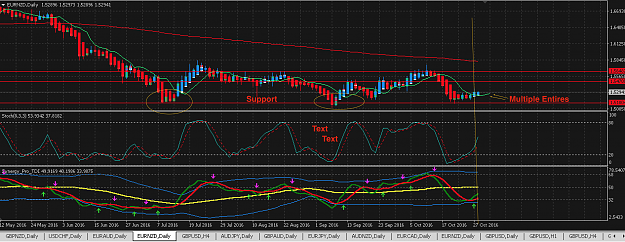
EUR/NZD - Long from Daily Support. Entering staggered with longs at 1.5275, 1.5250. 1.5225. 1.5200. All comments welcome and thanks to all those who make this such a great thread to learn and grow in.
Trading Made Simple
- Daniel 777 replied Oct 26, 2016
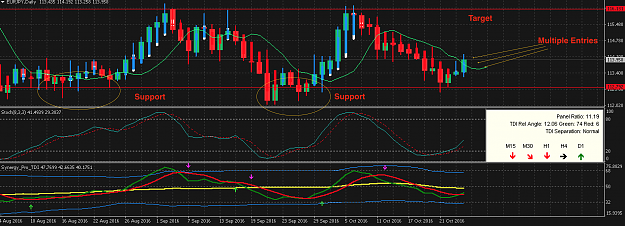
Daily EUR/JPY TMS Entry Multiple Entries 1st entry at Daily market 2nd Buy limit at 113.62 3rd Buy limit at 113.36 Price is at a Key Support Level and target is Top of range. Will trail stop when in profit on Daily Chart.
Trading Made Simple
- Daniel 777 replied Oct 25, 2016
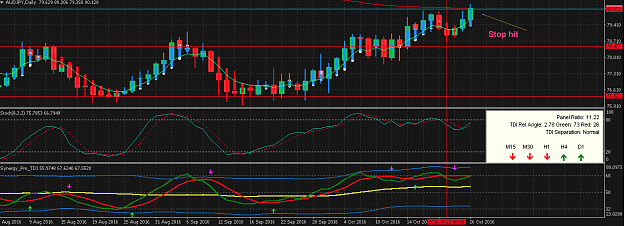
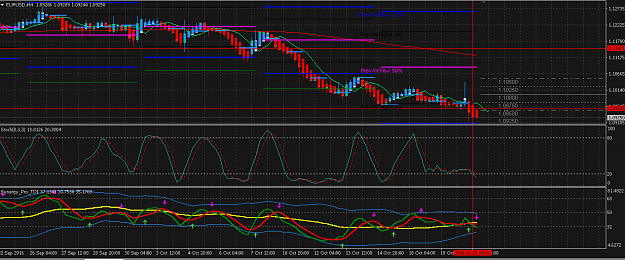
Dear Traders, Here is a Daily TMS trade that I have just been stopped out on - I posted the set up when I took it and would love to learn from this. My reasoning for taking the set up is above. What should I learn from this ?
Trading Made Simple

- Daniel 777 replied Oct 25, 2016
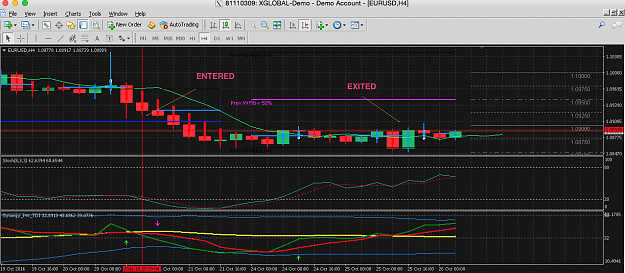
[quote=Daniel 777;9213603] Closed my second portion of EUR/USD short yesterday pm (GMT time) when I saw pressure building for a retrace.
Trading Made Simple
- Daniel 777 replied Oct 23, 2016
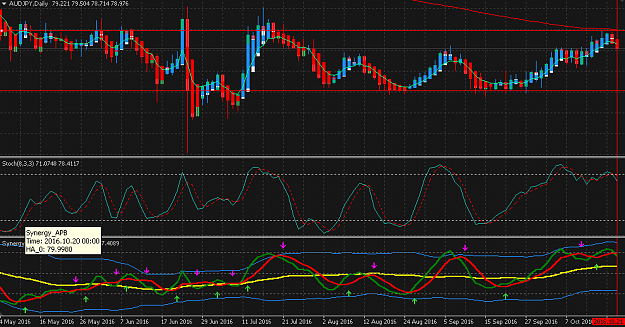
Here is a trade I am taking on the Daily Chart with the Open on Sunday PM. It is on the AUD/JPY Daily. We have a Red crossing Green on the Second APB candle. Price is below 200EMA, rejecting overhead Resistance at BRN 80 and red TDI line is pointing ...
Trading Made Simple
- Daniel 777 replied Oct 23, 2016
[quote=emmanuel7788;9212169] you made good profits with this trade
Trading Made Simple did you protect your remaining at BE at minimum. we shall see what the weekend gap will be like when NY opene on Sunday afternoon. I closed my last position 0.08680. we do not ...
- Daniel 777 replied Oct 20, 2016
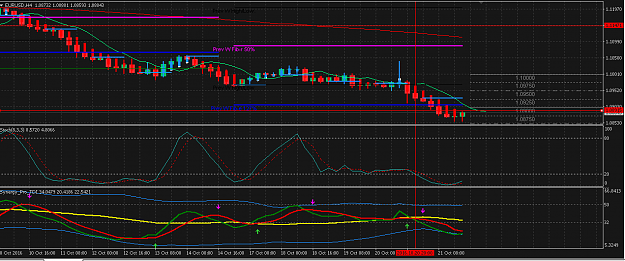
Took this 4 hr Chart EUR/USD Trade. With price breaking through key support and price turning down and TDI setup. Gone short and going to try and pull to BE before major news tomorrow (EU Leaders Summit). All comments welcome traders!
Trading Made Simple
- Daniel 777 replied Oct 20, 2016
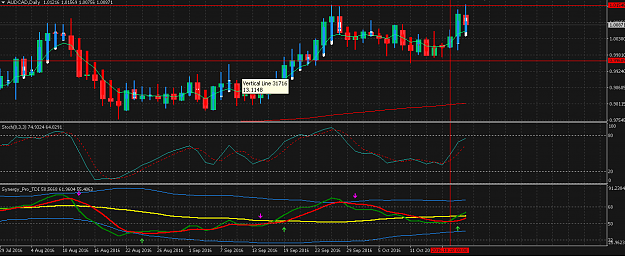
Entered AUD/CAD on Daily Chart long. Holding to try and break through overhead Resistance as Bullish candle running up to level...
Trading Made Simple
- Daniel 777 replied Oct 17, 2016
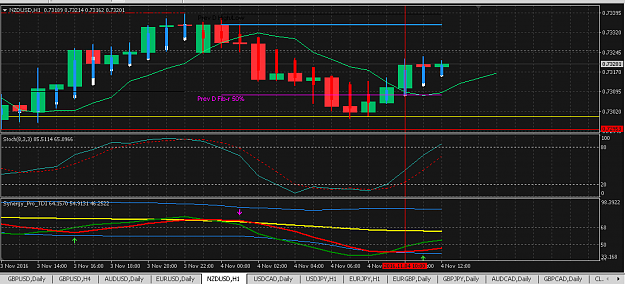
NZD/USD Daily Chart. Entered by 1st APB Candle after Green Cross Red (Angle 2 O'clock). As the Weekly is down (and I am short!) I will be targeting about 70 - 100 points. Taking partial profit and taking remaining to BE.
Trading Made Simple

- Daniel 777 replied Oct 17, 2016
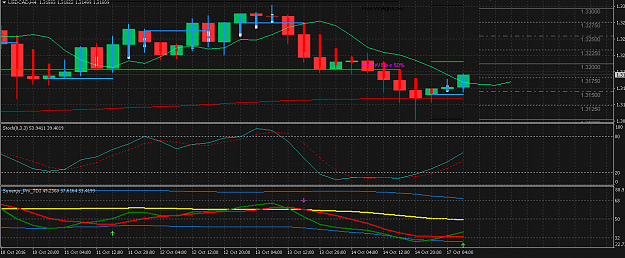
USD/CAD - 4 hour entry candle shown (now closed on my broker time) - stop at 1.3100. Green cross red (12-2 angle) and price sat on 200 EMA on 4 hour and on trendline on Daily chart. Holding for 4 hours and then moving to B/E and taking partial ...
Trading Made Simple
- Daniel 777 replied Oct 13, 2016
Hi all, Been following along for a month and trying to learn this method. Thank you to all who contribute. Daily sell taken on EUR/AUD. Targeting 1.450. To all you TMS guys who have this licked, does this seem an ok trade for a daily timeframe?
Trading Made Simple

- Posts by Member Search: 'Daniel 777'