- Search Forex Factory
- 49 Results
-
 altzspec replied Dec 19, 2018
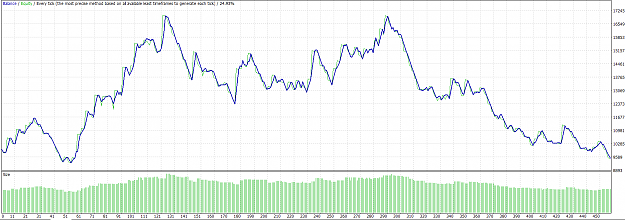
Painful lesson last week. All because the stop loss is not triggered. I shall do a Cordier Apology to myself. ;/ Not to worry, it is not a real account. Cordier Apology: A term to mean heartfelt apology with tears dripping.
My Trade Ideas and Observations
- altzspec replied Dec 9, 2018
Something happened recently this week url url url "There are so many forces weighing against markets right now, whether it's the China slowdown, weak European data, Fed hikes, uncertainty around trade and now Brexit as well." "The CME Group ...
My Trade Ideas and Observations
- altzspec replied Oct 19, 2018
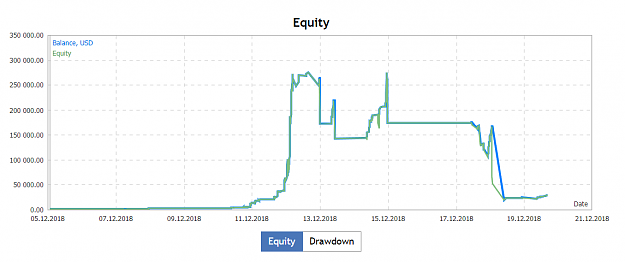
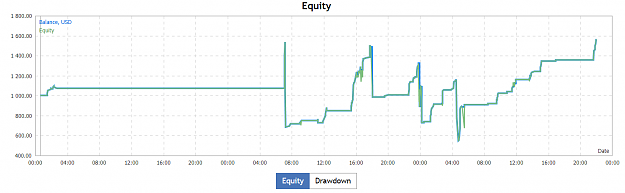
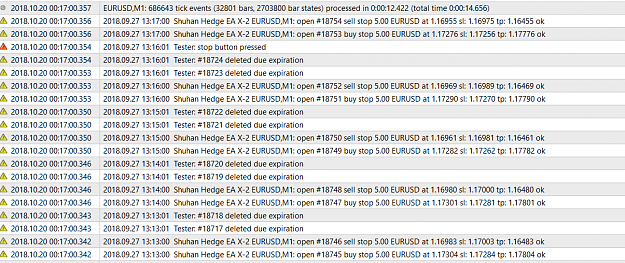
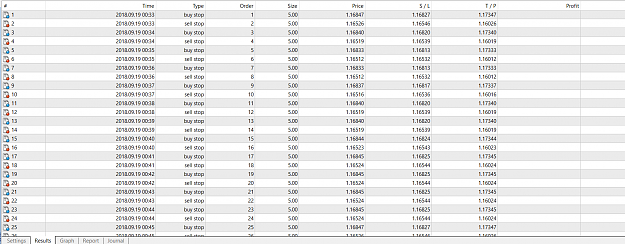
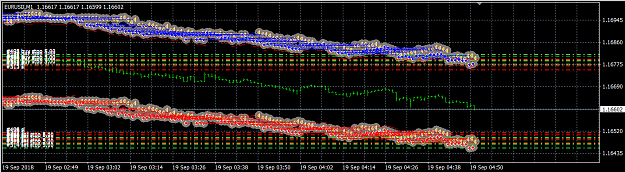
OutThere, you tested it on live account? I have tried running the EA, but only stop orders are fired with them expired later on in my demo account when using $3000 on leverage 1:1 ~ 1:50. image This is the result when using $3000 on leverage 1:200 ...
A brief summary of what I learned in the past 17 years
- altzspec replied Jul 22, 2018
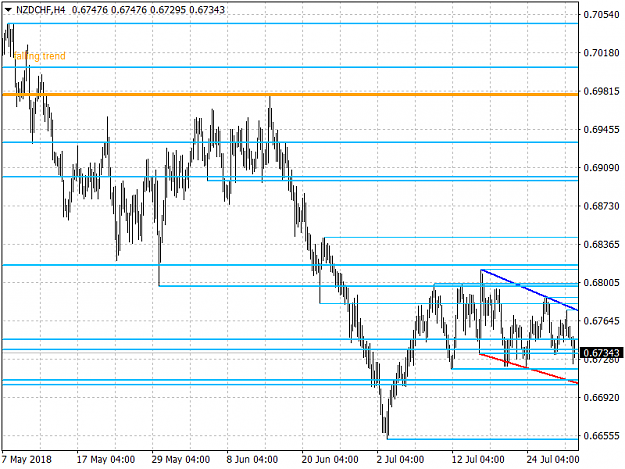
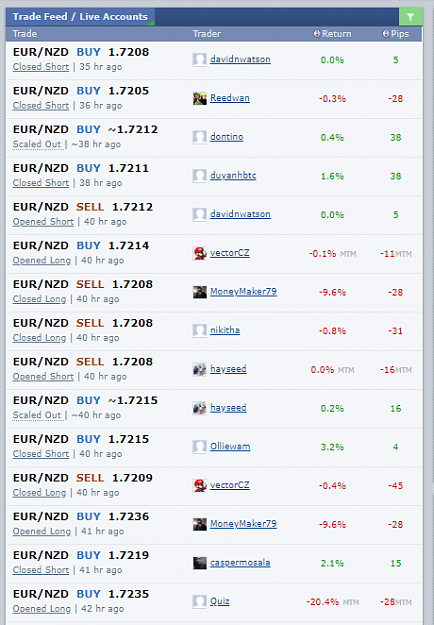
Sentiment is building up on EURNZD. I am not sure if it is just solely on NZD. I look at pairs, rather than the base/quote currency itself. Update (Jul 19, 2018 Thursday): A trade call was made on FF by yours truly on EURNZD to see if anyone follows ...
My Trade Ideas and Observations
- altzspec replied Jul 19, 2018
I am going long. Anyone following me? Support: 1.71624 Resistance: 1.72160 image
EURNZD
- altzspec replied Jun 28, 2018
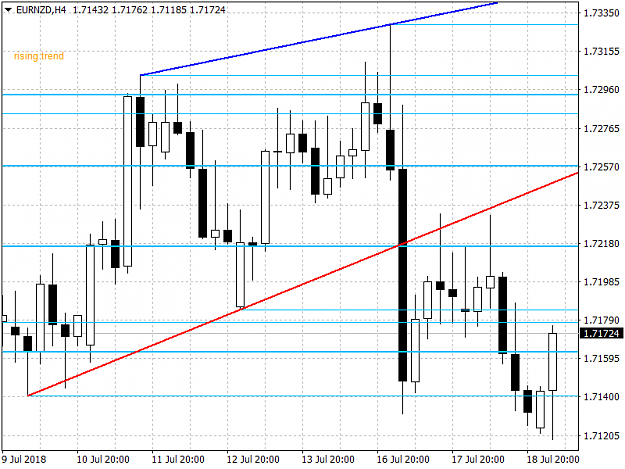
Short NZDCAD. Always follow the trend. Just broke out of the noisy channel. If you want to play it safe, you can wait till pull back to resistance at 0.90231 or higher. Keep short it down, people.
My Trade Ideas and Observations Resistance: 0.90231 Support: 0.89683 image
- altzspec replied Apr 12, 2018
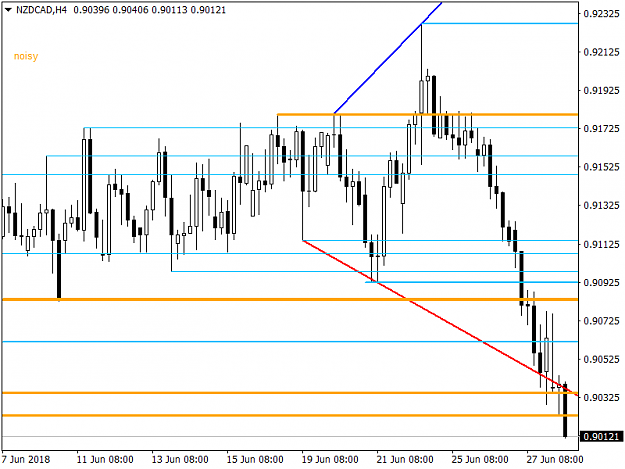
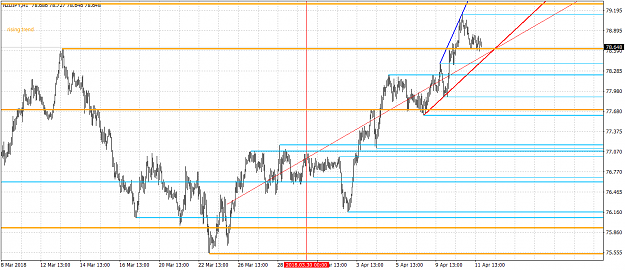
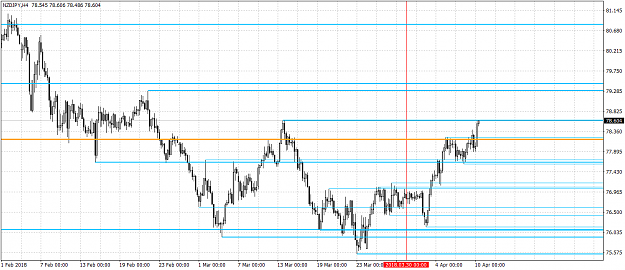
Price is now a few distance away from next resistance @ 79.294. Get ready to short or fade the move if one wishes (opinion) until 80.3. Need a few brave souls... image
NZD/JPY
- altzspec replied Apr 11, 2018
Bullish momentum has dropped into short term bearish. And now testing the support at 78.618 image
NZD/JPY
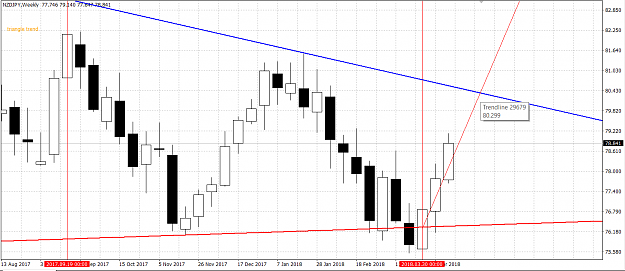
- altzspec replied Apr 10, 2018
Price should not go beyond the top bearish mega channel on Weekly chart. Intersection price at 80.30 .. (Not exact science) after cutting thru the central region (mean) of the prices. The longer the delay, the lower the top price. Expect maximum ...
NZD/JPY
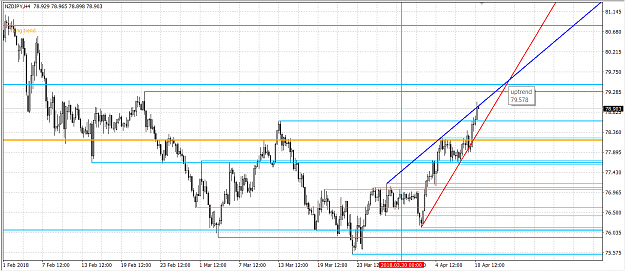
- altzspec replied Apr 10, 2018
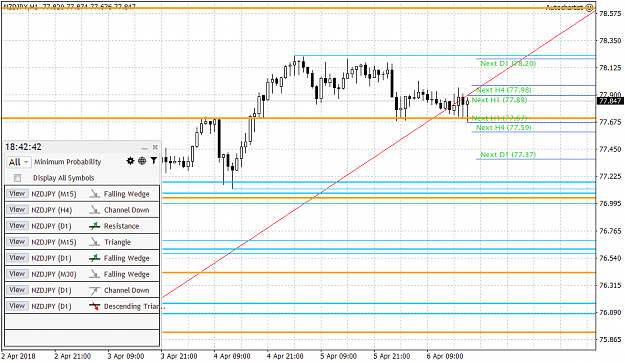
Projected short region for NJ chart on H4 timeframe. Somewhere around 79.578 is a good place to short as well, if you want to wait until after 79.292. image
NZD/JPY
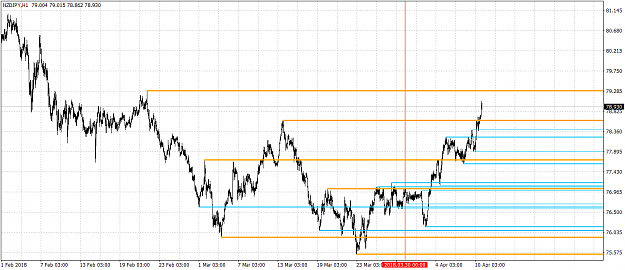
- altzspec replied Apr 10, 2018
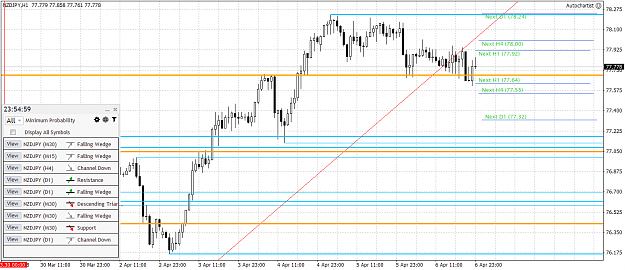
We are coming to 79.292 which is the next resistance on H1 time frame. Be ready to short it when it fails the test there. Expect heavy market activity at this region. image
NZD/JPY
- altzspec replied Apr 10, 2018
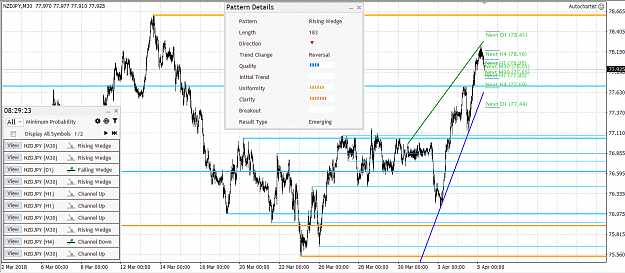
This is H4 time frame. As can see here, the price has reached the resistance at 78.612 Possible short from here or the next resistance @ 79.294 Still a rising wedge. image
NZD/JPY
- altzspec replied Apr 6, 2018
There was a dip into the support at 77.704 just before market closed. A bullish pullback might occur next week before finally breaking through support. image
NZD/JPY
- altzspec replied Apr 6, 2018
Price has rejected several times (counted 6 times) off support at 77.704, but high likely price will drop any day soon next week. Bullish momentum seems to be weaken. Good shorts will still be at 78.615 and 79.283 which are higher resistances. ...
NZD/JPY
- altzspec replied Apr 5, 2018
This rising wedge will not last forever. We now have a bearish signal coming out of autochartist. url Regardless of the type (reversal or continuation), rising wedges are bearish. image
NZD/JPY
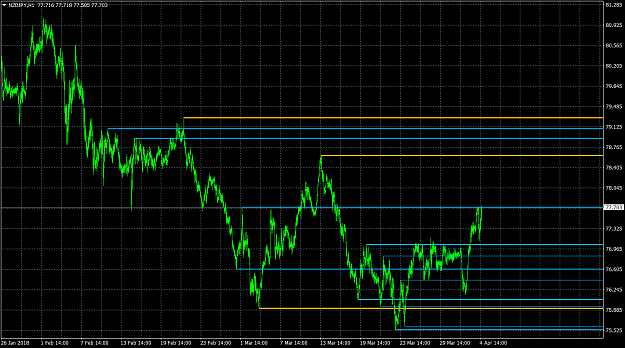
- altzspec replied Apr 4, 2018
Anyone martingale short NJ from this point onwards? Please a show of hands. Need some replies. Thanks. Update: Just touched resistance line at 77.697 Next key resistances: 78.615, 79.283 image
NZD/JPY
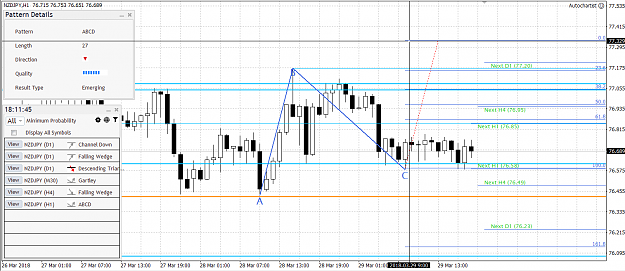
- altzspec replied Mar 29, 2018
ABCD pattern encountered on NJ. Verdict: Bearish Watch price at 77.329
NZD/JPY
- altzspec replied Mar 26, 2018
Trend remains bearish. Still have more room to make alot more short scalps. Next resistance: 77.637 A cluster of resistances are from 78.219 - 79.283. image
NZD/JPY
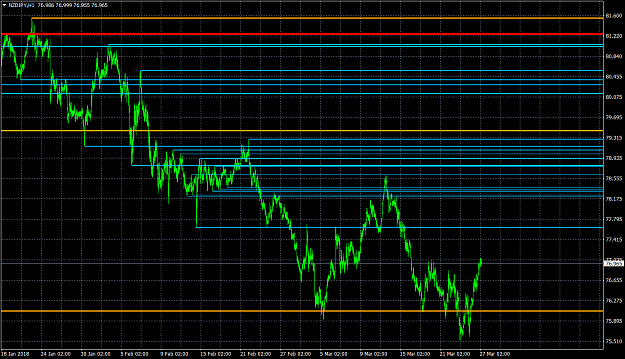
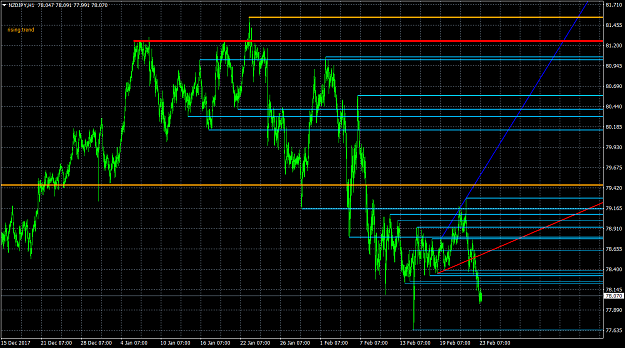
- altzspec replied Feb 23, 2018
The floor has been breached. Keep shorting at every resistance. STRONGLY bearish. image
NZD/JPY