- Search Forex Factory
- 61 Results
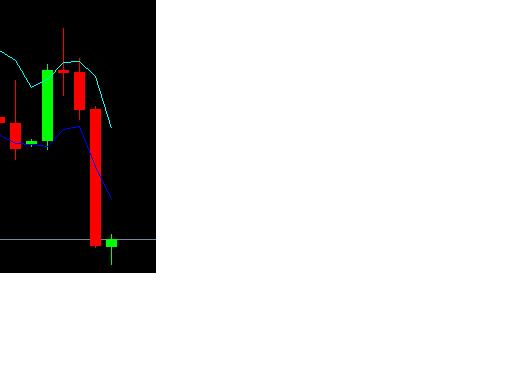
- $teve replied Mar 23, 2012
Might be a good place to buy with tight stop if this trendline holds.
Auslanco - GBP/JPY and GBP/USD (newstrade)
- $teve replied Feb 26, 2012
Has anyone noticed that this major weekly trendline is being broken. If this week's candle closes about 129.50, I think we're in for some serious bull run. Just buy GJ and hold with tp at 140 or come back in a few months.
GBP/JPY, GBP/USD, and EUR/USD (technical analysis)
- $teve replied Jun 8, 2010
A close below 131 would mean the break of this strong yellow trendline as well as the H&S neckline. I'm flat right now and just waiting for a break of either way to join in. This next breakout will produce a large move so I guess I can wait and try ...
Auslanco - GBP/JPY and GBP/USD (newstrade)
- $teve replied Jun 7, 2010
Trendline isn't an exact science. Sometimes there's many different ways to draw a trendline and choosing which wicks to include in result in different trendlines. In your chart, you're not including the lowest wick. This is mine.
Auslanco - GBP/JPY and GBP/USD (newstrade)
- $teve replied May 27, 2010
Must have been on a different forum but this daily channel makes it pretty obvious where to buy and sell. Sometimes trading is as simple as drawing two straight lines. People tend to complicate things with too many indicators and over-analyzing.
Auslanco - GBP/JPY and GBP/USD (newstrade)
- $teve replied May 26, 2010
Doesn't look too wild to me. Breaks the blue trendline to go down. Break 130.50 to go up. Scalp everything in between. Simple.
Auslanco - GBP/JPY and GBP/USD (newstrade)

- $teve replied Nov 24, 2008
156? — It's possible this week if we break this trendline and stay above it (not fake out). I think if the dow closes strong today and not sell off in the last hour, there might be a very nice long trade coming. 4H 200ema is currently around ...
Auslanco - GBP/JPY and GBP/USD (newstrade)
- $teve replied Nov 3, 2008
This is a very interesting system. I will keep monitor how well it does in the next few months of live trading. First trade of the month and it's already about 400 pips in profits. After looking at the backtest results, I think this system might ...
4H 5EMA System
- $teve replied Oct 21, 2008
This is one massive channel if it holds. I'm long from 169.40 targeting the 23.6 and 50 fib of this move down and the top of this channel.
Auslanco - GBP/JPY and GBP/USD (newstrade)
- $teve replied Oct 15, 2008
As you can see the pattern from the weekly chart, we are in correction mode up to the 23.6 fib which is at 186. I've been waiting for the 50% fib of this up move which is at 173.67 to enter long but GJ has been consolidating. I may enter half at the ...
Auslanco - GBP/JPY and GBP/USD (newstrade)
- $teve replied Oct 1, 2008
This move up is really baffling me because I never get surprised by GJ's movement. All the major moving averages on the monthly and weekly are above us. I suspect this is due to the bounce off of the monthly trendline again. Back in august 2000, ...
Auslanco - GBP/JPY and GBP/USD (newstrade)
- $teve replied Sep 16, 2008
Looks like GJ might be forming this channel. If that is the case, it could be heading for the top of this channel.
Auslanco - GBP/JPY and GBP/USD (newstrade)
- $teve replied Sep 12, 2008
It just bounced off hourly gann but still trading above it. A close below 1H gann would mean 50% retracement to 188.26 also to retest broken resistance. That's the best place to add longs if it gets there.
Auslanco - GBP/JPY and GBP/USD (newstrade)
- $teve replied Sep 11, 2008
Well it's still well within this descending channel. I wouldn't be surprised to see it bounce up to the top of the channel again (188.30ish) then bounce down.
Auslanco - GBP/JPY and GBP/USD (newstrade)
- $teve replied Sep 11, 2008
That last bounce was amazingly accurate.
Auslanco - GBP/JPY and GBP/USD (newstrade)
- $teve replied Sep 10, 2008
Pretty defined channel between the two blue lines. Sometimes I just keep trading very simple. Sell at top and buy at bottom. Who said trading a range is bad?
Auslanco - GBP/JPY and GBP/USD (newstrade)
- $teve replied Apr 30, 2008
Critical Monthly Candle — This month's candle will close in about 4 hours. If GJ manage to close today's candle above 207, then this month's candle is very bullish. I circled the two previous instances where GJ changes its long term trend from ...
Auslanco - GBP/JPY and GBP/USD (newstrade)
- $teve replied Apr 30, 2008
Rising channel - uptrend — This is the reason why I've been bullish for the past couple of weeks. GJ is moving nicely on a rising channel. Currently GJ is on its way to the upper trendline (210 area). The market has priced in a .25 cut. If ...
Auslanco - GBP/JPY and GBP/USD (newstrade)
- $teve replied Apr 22, 2008
Looking at the monthly trendline, you can see that price does NOT have to touch the trendline to bounce. If you've been using a lot of trendlines, you will notice that sometimes price does not touch the trendline before it bounces. This might be the ...
Auslanco - GBP/JPY and GBP/USD (newstrade)