-
GBPUSD Technical Analysis - Key levels in play
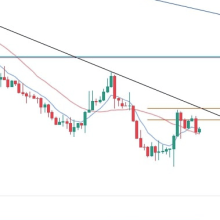
On the daily chart, we can see that the GBPUSD pair pulled back yesterday into the blue 8 moving average where it’s finding some resistance. From a risk management perspective, the sellers would have a much better risk to reward setup if the price pulled back all the way up to the 1.2398 resistance where we can find the confluence with the trendline, the 38.2% Fibonacci retracement level and the red 21 moving average. The buyers, on the other hand, will need the price to break above the trendline to turn the trend around. chart On the 4 hour chart, we can see that the latest leg lower diverged with the MACD which ... (full story)
- Comments
- Subscribe
-
- Older Stories
 From dol.gov|Oct 5, 2023|7 comments
In the week ending September 30, the advance figure for seasonally adjusted initial claims was 207,000, an increase of 2,000 from the previous week's revised level. The previous ...
 From bankunderground.co.uk|Oct 5, 2023
Central banks have been using a range of monetary policy and macroprudential tools to maintain monetary and financial stability. But when should monetary versus macroprudential ...
 From bea.gov|Oct 5, 2023
The U.S. Census Bureau and the U.S. Bureau of Economic Analysis announced today that the goods and services deficit was $58.3 billion in August, down $6.4 billion from $64.7 ...
-
- Newer Stories
 From cnbc.com|Oct 5, 2023
A Miami federal judge ordered a lab owner convicted of defrauding Medicare to forfeit more than $187 million worth of proceeds from the scam, including $30 million in cash, a 2018 ...
 From think.ing.com|Oct 5, 2023
A lack of transparency and a convoluted financing system have raised fears that the problems of China’s property development companies and the spillover to local government ...
 From marketwatch.com|Oct 5, 2023
The U.S. Energy Information Administration reported on Thursday that U.S. natural-gas supplies in storage rose by 86 billion cubic feet for the week ended Sept. 29. On average, ...
- Story Stats
- Posted: Oct 5, 2023 9:12am
- Submitted by:Category: Technical AnalysisComments: 0 / Views: 3,670