-
Hidden Bullish Divergence
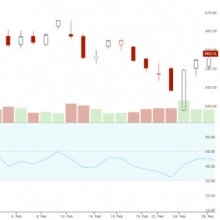
In technical analysis a divergence pattern is a signal on a chart that occurs when the price of an asset is moving differently than a technical indicator. A divergence can show that the chart is becoming bullish and the chart may be beginning an upswing or uptrend in price action. What is a Hidden Bullish Divergence? A hidden bullish divergence happens in an uptrend when the price of an asset makes a higher low while the oscillator is making a lower low. This is seen as price action signaling the chart is showing upside potential as it diverges from the technical indicator’s new low. Price is growing stronger as ... (full story)
- Story Stats
- Posted: Apr 10, 2022 3:20pm
- Submitted by:Category: Educational NewsComments: 0 / Views: 2,119