-
Technical Analysis Cheat Sheet
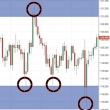
Technical analysis is the art and science of reading price action on a chart. Here is a quick reference guide that can be used as a cheat sheet. A range bound market can be identified by horizontal upper resistance and horizontal lower support. image When price breaks out of a trading range it can signal the potential for a new trend in price: image Trend lines are a way to identify a current trend by connecting vertical levels of price resistance and support on a chart. image The MACD can signal the beginning of swings and trends on a chart: image RSI can be used to establish the risk/reward ratio on a chart ... (full story)
- Story Stats
- Posted: Jun 14, 2020 6:19pm
- Submitted by:Category: Educational NewsComments: 0 / Views: 10,998