-
About Forex Factory / Blog / Get a fresh start with Trade Explorer
Get a fresh start with Trade Explorer
March 20, 2012
With the new 'Custom Start' feature, you can now specify a date that your Trade Explorer begins including brokerage account history. Strategies change, styles evolve, traders become smarter – all are good reasons you might want to exclude old performance from your metrics. While traders shouldn't forget lessons of the past, it's a lot easier to analyze performance when irrelevant trades are excluded.
To set up a custom start date, click 'Options' at the top-right of your Trade Explorer, and enter a date in the 'Custom Start' section, as shown below.

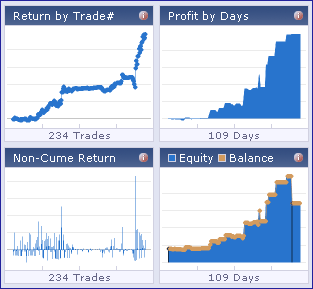
You may have also noticed that we recently changed the graph setup on the 'Overview' tab. Instead of one Flash-based graph, the Trade Explorer now has four image-based graphs on the main tab. This change gives you a thorough overview of the account with just a glance, plus it loads faster because it's no longer based on Flash technology (which was our initial motivation for changing).
The new graphs also interact with the 'Performance' table rows – click the small blue icon on each row to make the graphs represent only that particular period. This is a handy way to zoom in on performance for the year, month, week, or day.

Haven't tried the Trade Explorer yet? Get started here! Or if you have feedback or ideas for improvement, we're always glad to hear from you.
To set up a custom start date, click 'Options' at the top-right of your Trade Explorer, and enter a date in the 'Custom Start' section, as shown below.
You may have also noticed that we recently changed the graph setup on the 'Overview' tab. Instead of one Flash-based graph, the Trade Explorer now has four image-based graphs on the main tab. This change gives you a thorough overview of the account with just a glance, plus it loads faster because it's no longer based on Flash technology (which was our initial motivation for changing).
The new graphs also interact with the 'Performance' table rows – click the small blue icon on each row to make the graphs represent only that particular period. This is a handy way to zoom in on performance for the year, month, week, or day.
Haven't tried the Trade Explorer yet? Get started here! Or if you have feedback or ideas for improvement, we're always glad to hear from you.

Comment
6
comments