{quote} Where do we get the real volume . What about fdax , futures volume .This has raised my interest in volume even more.
Ignored
"Real Volume" or futures volume through exchanges isn't as reliable as Tick volume. Through regulated markets such as futures, large purchases can be delayed in reporting to the exchange due to it can give away when when a large trading firm takes a huge position. If other firms realize a large position has been taken they can try to swamp the market and turn the market against the first firm who took the large position and try to squeeze them out of their position and cause a large loss. The most notorious is the FTSE (London stock exchange) volume can be delayed in being reported up to 36 hours.
People love to believe that professionals/big boys/large trade institutions are out to get retail. Truth is they don't care about our micro/mini lots. They already know that the majority of use don't have a clue and will eventually destroy ourselves. But this is besides the point.
You can't delay data on tick volume, when large orders are filled they are filled in blocks. While these blocks are being filled you have massive amounts of orders being filled on both sides which is going to make price tick very rapidly. This is all you need to know, it doesn't matter that its completely accurate, what matters is you know when and where the large positions are being filled and how the market reacts to to the large positions.
{quote} "Real Volume" or futures volume through exchanges isn't as reliable as Tick volume. Through regulated markets such as futures, large purchases can be delayed in reporting to the exchange due to it can give away when when a large trading firm takes a huge position. If other firms realize a large position has been taken they can try to swamp the market and turn the market against the first firm who took the large position and try to squeeze them out of their position and cause a large loss. The most notorious is the FTSE (London stock exchange)...
Every day when you first open your trading platform. The first thing you should look at is the Daily time frame as an intraday trader. Daily still should be looked at even if you're trading a M1.
The Daily chart is so important, you should have an idea what is going on the Daily otherwise you might as well be trading with a blind fold.
First thing is what has price done the last few days?
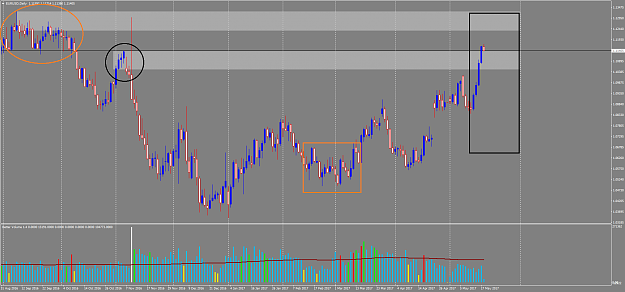
Look at the black square, the last few days each bar is making a HH and HL? Don't go short in this market.
Now take a look at the orange square, the PA is really messy, there aren't any HHs/HLs or LHs/LLs. When the price is like this you can take long/short positions during a single day. Just don't expect to get 100+ pips out of trades here.
Second thing to look at on daily chart is what is to the left.
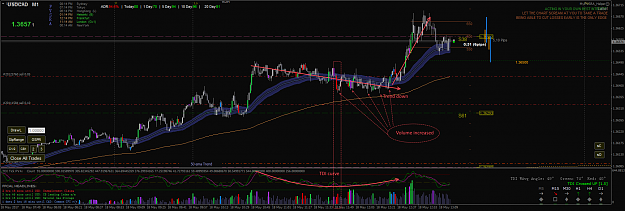
In the black circle where we are at currently we have a small consolidation area, we expect to find a bit of hesitation at this price level, but also price could push through this level. This area its too soon to look for shorts, but also you don't want to be looking for any long term longs here either. I would probably favor scalping to the long side. The only way I would short here is after seeing repeated signs of weakness.
In the orange circle we have a much larger consolidation area, this is where I would be looking to get rid of most if not all of any long term buy orders. And start looking for weakness.
{quote} Every day when you first open your trading platform. The first thing you should look at is the Daily time frame as an intraday trader. Daily still should be looked at even if you're trading a M1. The Daily chart is so important, you should have an idea what is going on the Daily otherwise you might as well be trading with a blind fold. First thing is what has price done the last few days? Look at the black square, the last few days each bar is making a HH and HL? Don't go short in this market. Now take a look at the orange square, the PA...
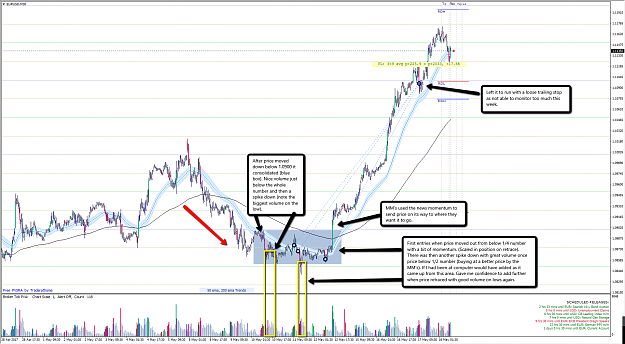
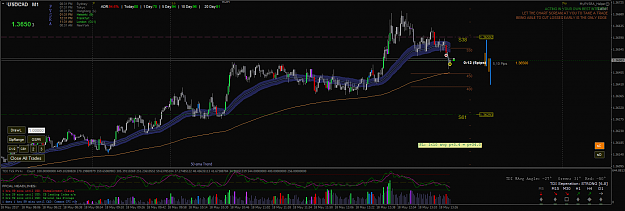
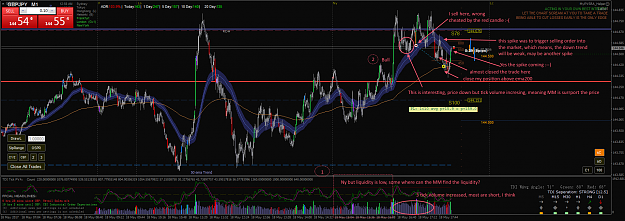
This is just a small position, I'm just testing the water so to speak.
Daily is bullish, we have buying that came in on this M5 chart and to the left we see the buying came in at a consolidation area.
I'm really looking for the area of the orange square to be broken. Once this is broken I can look to add a large position. Once I enter a large position I can lock some profit on my smaller position to help ease things if my larger position fails. Also the small position is some money on the table if price is marked up rapidly and I don't get a chance to enter my larger position.
This is just a small position, I'm just testing the water so to speak. Daily is bullish, we have buying that came in on this M5 chart and to the left we see the buying came in at a consolidation area. I'm really looking for the area of the orange square to be broken. Once this is broken I can look to add a large position. Once I enter a large position I can lock some profit on my smaller position to help ease things if my larger position fails. Also the small position is some money on the table if price is marked up rapidly and I don't get a chance...
Ignored
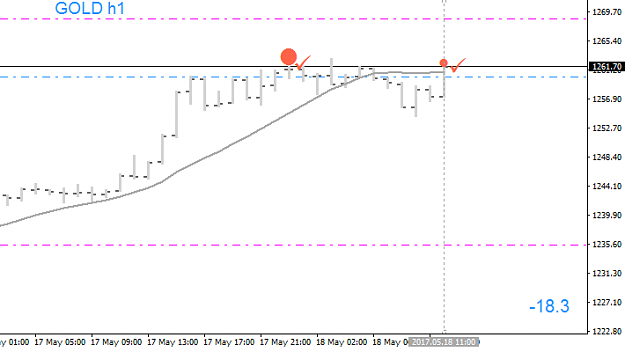
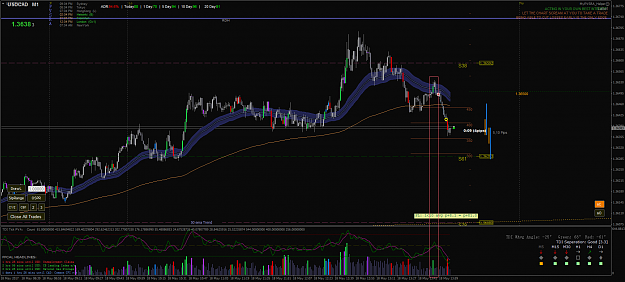
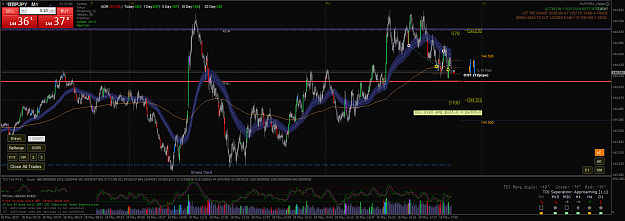
It got me.. Market couldn't break the high it seems.
Trying to work with Volume as an odds enhancer in my own trading. Funny to see the difference in using volume .
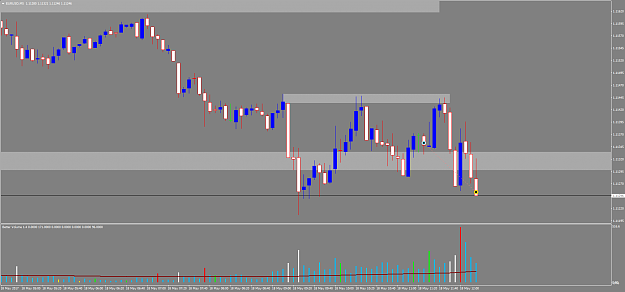
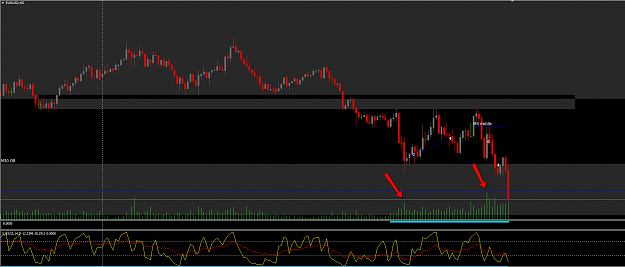
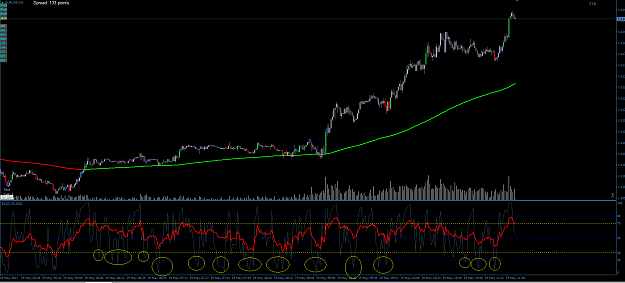
This is how i use it: At certain pricepoints i expect market to move fast. It is always for a reason. Or market wants to take out stops above or below recent high/lows, or the market has interest in bying/selling at certain pricepoints.
At the EURUSD example; i had marked out a M30 orderblock (M30 OB) and there was a quick pricedrop with a high volume. It tells me that there is buying going on, so i entered a long. (got out a bit late)
A bit later price reacted to 1.1145 again and dropped, leaving a footprint with a M5 OB. Prive reversed (to the middle) with a big volume bullish candle. That was a sell signal (to me). I could have held longer, but we are still in a M30 OB and the reaction of the recent low.
Still learning, but looks promissing.
Trying to work with Volume as an odds enhancer in my own trading. Funny to see the difference in using volume . This is how i use it: At certain pricepoints i expect market to move fast. It is always for a reason. Or market wants to take out stops above or below recent high/lows, or the market has interest in bying/selling at certain pricepoints. At the EURUSD example; i had marked out a M30 orderblock (M30 OB) and there was a quick pricedrop with a high volume. It tells me that there is buying going on, so i entered a long. (got out a...
Ignored
I'm no volume specialist that's for sure, but can only see value using volume on very small t/fs....ie quick in and out scalping type of strategy where entry and exit are obviously that much more critical. Therefore, certainly with my style of trading where longer t/fs are used, it then becomes unnecessary for me to be concerned with volume because price action (in the main) guides my decision making.
Hi, first time post here, hoping I'm right A classic "take a break and refill long orders", didn't take the trade, thinking the big picture was bear By the way, the TDI curve confused me! Update: I took a quick short after written the post Wiserltz {image} {image}
Ignored
Seems scalpers are coming in the right place ! Welcome even i just joined this thread
There is no way to happiness , happiness is the way.