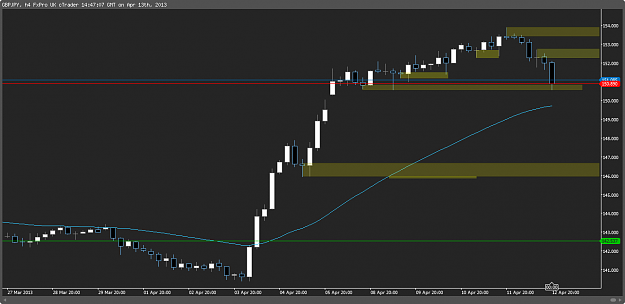
DislikedGood morning GDRI'm curious what MA you have on this 4H chart? Also, I notice you put a lot of attention into those 4H spinning tops and remember you saying (last week I think) that when you see them, the next bar often tests the low/high and then takes off in the current trend direction. I've been looking back at some since you said that and it would seem more often than not it happens. Interesting and something I will watch in the coming days/weeks.
Ignored
Yep, the next bar or if it doesn't you can usually expect a pullback to the candle in question after a short while. With that said, it happens on most timeframes.
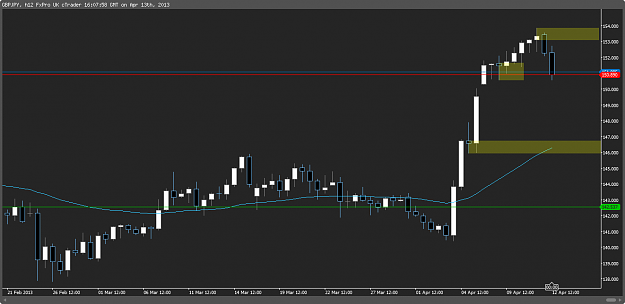
12hour chart below and the 4hour I posted earlier.
Edit; I forgot to add, once an area has been hit during the current price wave, I disregard it and don't use it again and instead look for the next level up or down which price hasn't returned to since that candle/area was formed.
[[I'm not very good at explaining things
Attached Image(s) (click to enlarge)