DislikedI agree with you, Nidolap. FxRetro techniques demonstrate his own methods, they could be brilliant, good for him, but has very little to do
with what we are trying to study here in this thread. Indeed, eur/aud H1 chart posted here doesn't show any trigger to short based on moves around
moving averages, Daily trend is UP. Even if the daily trend is ending for eur/aud, we do not jump into trades trying to predict market reversals. We
patiently wait, until reversal happened, see that it is confirmed and then follow the new trend.
I would suggest...Ignored
Time Frame…
1H
Indicators I Use
•HeikenAshi - Initially When I started I used it, However I’ve stopped using it now….. As I see the candle stick patterns are more than enough to enter/exit a trade….
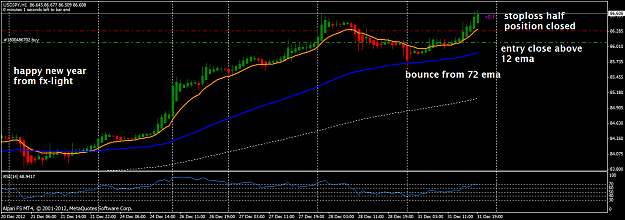
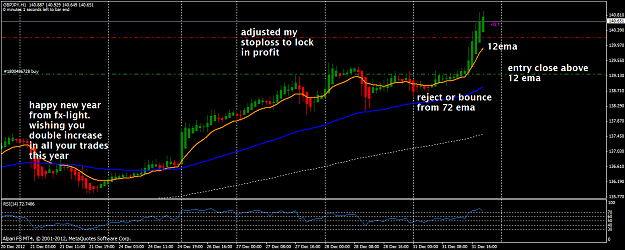
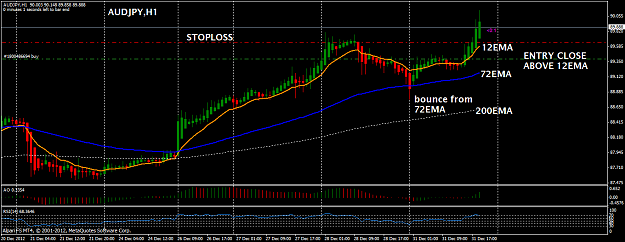
•72 EMA Closed – Average trend of three days (24*3)
•12 EMA Closed – Average trend of the day (1*12)
•Supply/Demand – Place the Support/Resistance When You See them
•Round Number - Physiological Level is a market sentiment / a key level to watch
Entry :-
•Look for a Reject from 72 EMA
•Enter after the price closed above/Below the 12 EMA
•The entry Candlestick should be one single bar rejecting from 72 EMA & Closing Below/Above 12EMA & should be a Pinbar, Marubozu, Engulfing Pattern… Etc
Exit : - Its Up to a trader to decide depending on his/her risk, I personally close After the price closed below/above the 12 EMA or on a reversal or support/resistance etc...
Stop Loss ;- Swing High or Swing Low / Above or Below 72 EMA.
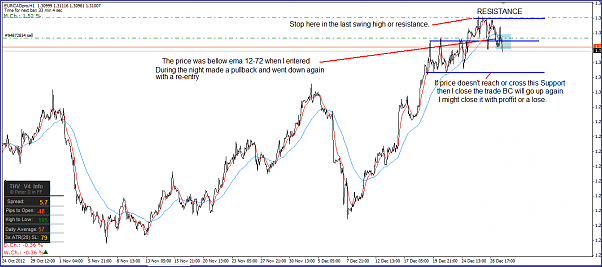
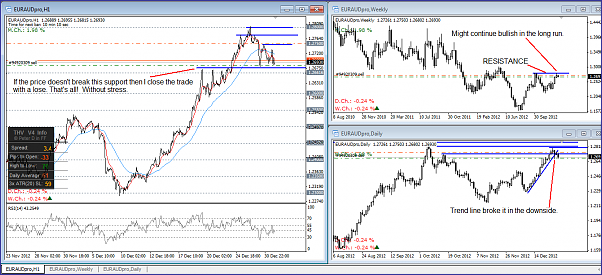
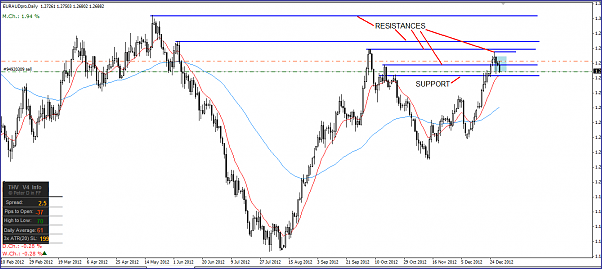
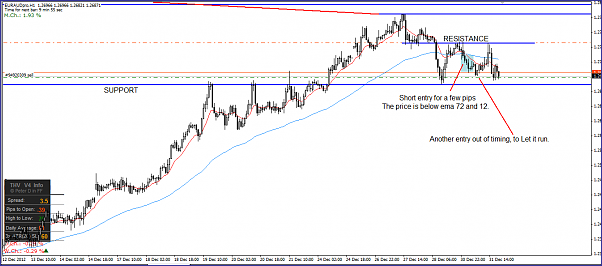
The 1D or 1W chart is just to have a better confirmation of what is going to happen in 1H. Bellow I show a 1D and 1H chart of the EUR-AUD from today. Sometimes Im late when I open the charts but if I see that for the long run is probable that the price might continue is current direction I put a trade to let it run until is positive. If the time pass and it is not positive, then I closed. Other times the market takes me out. That's all!
Attached Image(s) (click to enlarge)
Swing with the tide, Surf with the waves!