Hey Pippette, nice to see you again. Hope your trades are going all Green!
Could you tell me which TF and session do u feel is the most successful with this method?
Ignored
Most traders here including me stay away from anything shorter than 1h, I'm in US east coast time zone, so I trade 1H during US am, and 4H at night occasionally. (9pm EST and 5am EST candles. 1am rarely if I happen to wake up or stay up late). I wish I lived in Europe (am originally from Hungary..) would love to live and trade the London session there... I believe London session is the killer for this method. But in the US we have to be creative with other sessions too...
Many pips to ya!
I have been followng this thread for some time and am impressed the ways this method has been followed. Looks promising to me
I just took a short position on NZD/USD. Please do comment if anyone feels my entry is not correct
All the best to all!
Ignored
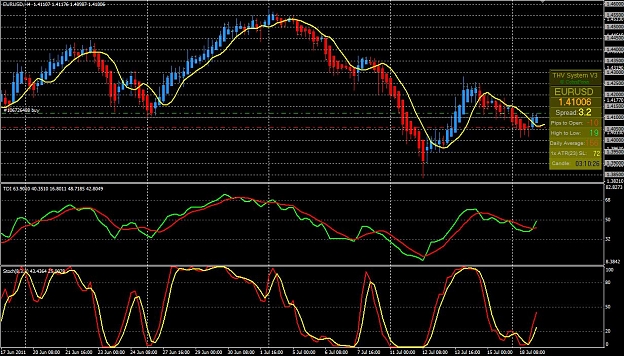
Somewhat tempting but:
1-outside 240 trading entry time (05-08 GMT +/-)
2-green TDI looks closer to 3 than 4 o'clock angle
3-entry is on candle #5 instead of 1 or 2
4-Stoch angle confirms direction but it's crossing 50 on my chart.
It's been in a 100 pip consolidation for 2+ days so eventually it will break out, but it could just as easily go up as down at this point.
I do think you'll be able to get at least a few pips if you watch it closely, and it just might break down and give you 60-80. Good luck!
JR
Ignored
Thanks to all for their constructive comments. Lot to learn
Learnt a lesson: should have stuck to the psychological TP at the pivot. I decided to watch while the price went beyond the pivot only to gush down below it. I lost a whopping 15pips after.
STICK TO YOUR RULES
No more clear signals on my portfolio. I'll check back at 22:00
Joined Jan 2011
|
Status: No Longer Trading
|546 Posts
A really simplistic but effective way of judging the trend is just looking at what colour the HA candle is on the daily TF. This MTF HA indicator does the job.
This really difficult to interpret angle (12-2 or 4-6) beauce angle depend of the level of zoom (more zoom strech chart and modify the angle.)
try buy, correct ?
Ignored
In my opinion on this trade you are buying right into a pretty major resistance line of 1.4150. I show it as a weekly/daily resistance level. Not a lot of room to move.
Sorry to bother again, but as you know synergy APB candles usually do not show where the price is, so my doubt is, when you refer you wait for the candle to close over or under the 5 ema, do you mean the price or the body of synergy APB candle. And also could you please tell me exactly the 5 ema seetings you use, because in some templates I see 5 sma shift 2 typical price and I see another seetings of 5 ema shift 3 typical price.
Thanks again for your answer
Ignored
I just wait for the candle to close over the ma.
The ma has a shift of 2.