So when it's strong means we have to SELL all JPY pairs, and
when it's weak means we have to BUY all JPY pairs.
What other factors do you take into account other than the strong/weak signal, or do you just go for that?
IMPORTANT: The JYP is more than likely to be "weak" during closed Tokyo market times so I wouldn't advise this indicator be used during the closed hours.
Ignored
For now we just use it alone but if you want to combine with S/R or other indicators before you take a decission it would be better. So, open your note book, write everything you found or your idea and share with us here... but observe it first...
i see you have a new one here..nice !
are we going to combine this indi with the index and trend indis?
i will start testing it right away..
btw..what is your setting for the multipurpose trade manager ?mine is not working, don't know why.
Thank you for you and the other contributors for this nice thread..keep it going bros
sorry for my english
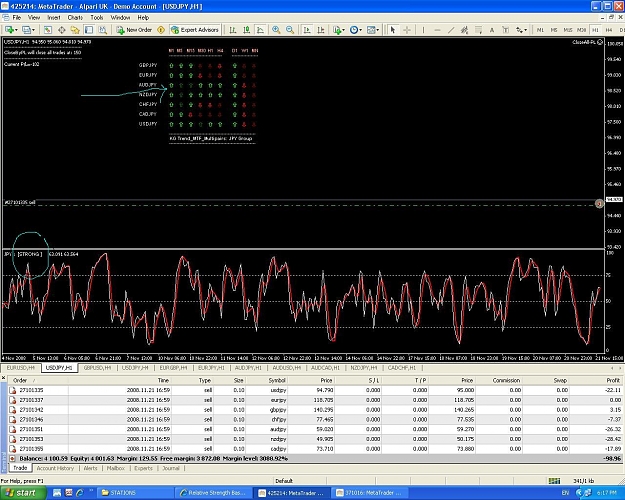
This indicator just for JPY only. The indicator only work at Time Frame H1 and that will be our base Time Frame. On the upper left you will see "JPY :[STRONG/WEAK/FLAT]"... this tell us the strength of JPY.
So when it's strong means we have to SELL all JPY pairs, and
when it's weak means we have to BUY all JPY pairs.
I'm trying to make it's easy for us, just try it first... combine with Multi_Purpose_Trade_Manager EA to control the basket profit and loss. I'm still test this indicators too...
not overally. just that if the number is low on like 15 30 1h then the arrows will jump back and forth a lot. when its all over 100 it just seems like an easier time to get in and get a few pips cause the trend is stonger on the basket. prob not big of a deal i was just wondering if they meant anything to you
Joined Oct 2008
|
Status: Sailing for pips
|2,099 Posts
I'm using the new RS indy
I'm still waiting for KG to let me understand the white and red line but what I've done is once first batch goes positive if the white is rising on buy or if red rising on sell I run another batch sort of a double dip
Last trade 12 wins no loss
|
Joined Jun 2006
|
Status: Misterpipster
|104 Posts
Hi KG,
Thanks for this new indicator. But, I don't get the Red and White MA's on the indicator. I use IBFX. Could you please advise on how to correct this? Thanks.
I'm using the new RS indy
I'm still waiting for KG to let me understand the white and red line but what I've done is once first batch goes positive if the white is rising on buy or if red rising on sell I run another batch sort of a double dip
Last trade 12 wins no loss
Joined Aug 2007
|
Status: I'm a Lemurians
|1,432 Posts
I have just check the code, and found a little bit miss calculations. So here the update version, just delete the first indicator or just copy and replace the first one with this one.
Thanks missed that one
so my experiment of once my basket is positive and the White trending up above red I do another Buy
Red trending down below white I do another Sell
Attached the first trade using the brand new indicator. However, looking at the chart and comparing the new indi with KG Trend (above), they are not in tandom.
The new one says "strong" while we clearly see that the arrows in KG Trend are mostly green up (i.e. jpy is weak!).
Attached the first trade using the brand new indicator. However, looking at the chart and comparing the new indi with KG Trend (above), they are not in tandom.
The new one says "strong" while we clearly see that the arrows in KG Trend are mostly green up (i.e. jpy is weak!).
Kg great indicator man Thanks!
I have a request, the script failed a lot many times because of requotes. Opened the tardes manually later and made profit too! BUT, if we have an script or EA where we can specify Maximum deviation from price it would be easier to palce orders?
Thanks missed that one
so my experiment of once my basket is positive and the White trending up above red I do another Buy
Red trending down below white I do another Sell
Kg great indicator man Thanks!
I have a request, the script failed a lot many times because of requotes. Opened the tardes manually later and made profit too! BUT, if we have an script or EA where we can specify Maximum deviation from price it would be easier to palce orders?
Ignored
Thank you shiva,
Yes, it's sometime happened to me too. But with Steve scripts i just run the script several time till the orders is placed.
And the idea to put Maximum deviation could be great, ok let the master of scripts do it for us. OK, Steve i think it's your part now...