ok i can see in your documents why you are using bb .
still 2 points what for is the NRTR ( u didnt talk about it in your document )and the psr
regards
Ignored
Yeah I'm sorry about that, I didn't figure that out yet, but I figured out the other indicators which help me a lot.
hi
thanks for sharing .
could you explain what for the psr and bb . since it is not included in the buy and sell rules ?
could you please from your experience the win / loss ratio for this system ?
regards
Ignored
But I can tell you my win/loss ratio is about 90% wins, but only because it's hard to distinguish the real signals from the fake ones. If you follow all the rules you should be able to win almost every trade.
|
Additional Username
|
Joined Mar 2008
|255 Posts
hi
sorry for so many questions .
and what about the asc trend 2 and what you mean by candle lit up . and where is asc trend 1 . ??
it is ovbious this system is intresting , i would like to know if the asctrend 2 paint the past ??
regards
What time frame are you using? I'm guessing 30m or higher because to Stoploss...Take Proft. Did you derive this system based on the one in the Metatrader forum? Thanks for presenting this.
What time frame are you using? I'm guessing 30m or higher because to Stoploss...Take Proft. Did you derive this system based on the one in the Metatrader forum? Thanks for presenting this.
Ignored
Yes, I downloaded this system from another forum but I forgot which one. I use no Take Profit because if I take profit of 30 pips, for example, then if the price keeps going in its direction, I miss all that profit past my Take Profit point. This is not getting greedy, this is doing my job as a trader raking in the most profits possible. Don't you people want that money? Ha?
The Time Frame I am using is 1 hour or higher. In the Pips School ( http://www.babypips.com/ ) it teaches to use multiple time frames, but not more than 3. I like to look at 1-hour, 4-hour, and Daily. Any time frame less than 1-hour is too much noise for me.
Yes, Stop-loss of 30 pips is more than enough as long as you follow the entry rules, such as wait for a signal. When you see a signal, that tells you a trend has started, but be careful with real signals/fake signals.
hi
thanks for sharing .
could you explain what for the psr and bb . since it is not included in the buy and sell rules ?
could you please from your experience the win / loss ratio for this system ?
regards
Ignored
I am not exactly sure what you mean by "psr" but if you are talking about "Parabolic Stop and Reversal" you can find out how it's used by going here: http://www.babypips.com/school/parabolic_sar.html
|
Additional Username
|
Joined Mar 2008
|255 Posts
hi
thanks , this system look good , i took 3 trades all winner .
i would like to know when you enter the trade: after the candle of signal close and you enter the next candle
or you enter while the candle is still open
regards
hi
thanks , this system look good , i took 3 trades all winner .
i would like to know when you enter the trade: after the candle of signal close and you enter the next candle
or you enter while the candle is still open
regards
Ignored
Usually I enter when all the indicators are going the same direction at the same time I get the ASCTrendSig and I usually close when the 2 moving averages cross again, sometimes a little before that so that I don't lose too much profit.
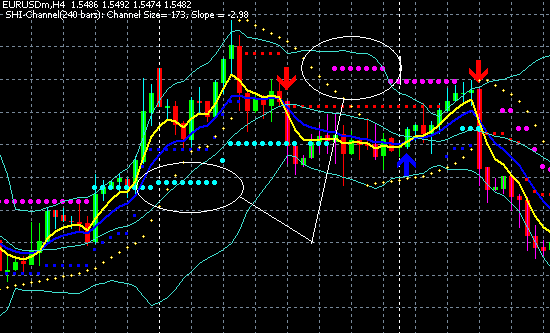
Another question, you mean candle lighted up is the circle as shown below ?
Attached Image
[quote=redrobin06;2118620]
01. Stop-loss = 30 pips. 02. Enter long if: a. 5-EMA crosses above the 10-EMA. b. RSI is above 50. c. ASCTREND up-arrow signal and candle lighted up by ASCTREND. d. Stochastics lines going up. e. CCI line is pointing up and above 50%. 03. Enter short if: a. 5-EMA crosses below the 10-EMA. b. RSI is below 50. c. ASCTREND down-arrow signal and candle lighted up by ASCTREND. d. Stochastics lines going down. e. CCI line is pointing down and below 50%.
01. Stop-loss = 30 pips. 02. Enter long if: a. 5-EMA crosses above the 10-EMA. b. RSI is above 50. c. ASCTREND up-arrow signal and candle lighted up by ASCTREND. d. Stochastics lines going up. e. CCI line is pointing up and above 50%. 03. Enter short if: a. 5-EMA crosses below the 10-EMA. b. RSI is below 50. c. ASCTREND down-arrow signal and candle lighted up by ASCTREND. d. Stochastics lines going down. e. CCI line is pointing down and below 50%.
Ignored
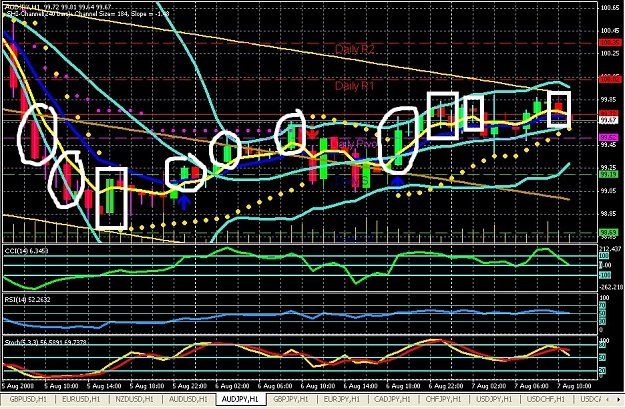
I want you to look at this chart very carefully. The candles that are circled are lighted up by ASCTrend. Those are the candles that are okay to trade. However, the candles that have a square around them, they are not considered lighted up by ASCTrend and therefore I don't trade them, unless they were already part of the trade. Sometimes I get out when I see a candle like the ones you see with a square around it, but depending on other indicators such as CCI, Stochastic Oscillator, RSI and Moving Averages. But I will never enter a trade with a candle such as the ones you see a square around it.
And to answer a question before, Yes, sometimes the ASCTrend arrow disappears, then re-appears, take great care on entering your trade when that indicator does that, that could indicate a fake signal. Remember, no system is 100% accurate, which is why I have many other indicators on my charts, so be careful.
How do you diffrentiate between circle candle and square candle ?
Is the candle far away from the yellow line trend consider valid,
and candle nearer to yellow line trend not valid ?
Ignored
No. Look at the candles again. Do you see the aqua line going through the middle of the green candle, and the magenta line going through the red candle? Those candles indicate valid trends in that direction, signaling that you should be in that trade already.
Do you see the magenta line going through the green candle, and the aqua line going through the red candle? That's an indication that the trend has possibly stopped or pulled back, and that you should get out of that trade immediately. Watch for a possible continuation after the pullback, then re-enter the trade if you want at 5% risk, according to my rules.
Do you see the red and green candles with no aqua or magenta lines? Those candles indicate a POSSIBLE formation of a trend and telling you to watch for a signal (ASCTrendSig or Up or Down Arrow) to enter a trade.
Look at the candles right above or below those ASCTrendSIG (Up or Down Arrows) signals. Those are candles lighted up by ASCTrend. Now look at the other candles compared to these candles. See the difference now? The candles lighted up by ASCTrend are the ONLY candles you should trade. Leave those other candles alone because they don't indicate a valid trend, BUT a possible formation of a new trend.
Those other indicators you see that are dots are just indicators of how strong that trend is, telling you whether to stay in that trade or get ready to get out.
Now remember, if you see the ASCTrendSig and the CCI and RSI are pointing in that direction, but the Stochastic Oscillator is pointing in the opposite direction, WATCH OUT. DO NOT enter a trade just yet. This could possibly be a FAKE SIGNAL and you don't want to be caught in that trade, possibly leading you right to your Stop-Loss.
If you follow all my rules to the letter, you should be able to win at least 95% of your trades. This system is all manual trading, no automation, and not for the lazy person.