No. Look at the candles again. Do you see the aqua line going through the middle of the green candle, and the magenta line going through the red candle? Those candles indicate valid trends in that direction, signaling that you should be in that trade already.
Do you see the magenta line going through the green candle, and the aqua line going through the red candle? That's an indication that the trend has possibly stopped or pulled back, and that you should get out of that trade immediately. Watch for a possible continuation after the pullback, then re-enter the trade if you want at 5% risk, according to my rules.
Do you see the red and green candles with no aqua or magenta lines? Those candles indicate a POSSIBLE formation of a trend and telling you to watch for a signal (ASCTrendSig or Up or Down Arrow) to enter a trade.
Look at the candles right above or below those ASCTrendSIG (Up or Down Arrows) signals. Those are candles lighted up by ASCTrend. Now look at the other candles compared to these candles. See the difference now? The candles lighted up by ASCTrend are the ONLY candles you should trade. Leave those other candles alone because they don't indicate a valid trend, BUT a possible formation of a new trend.
Those other indicators you see that are dots are just indicators of how strong that trend is, telling you whether to stay in that trade or get ready to get out.
Now remember, if you see the ASCTrendSig and the CCI and RSI are pointing in that direction, but the Stochastic Oscillator is pointing in the opposite direction, WATCH OUT. DO NOT enter a trade just yet. This could possibly be a FAKE SIGNAL and you don't want to be caught in that trade, possibly leading you right to your Stop-Loss.
If you follow all my rules to the letter, you should be able to win at least 95% of your trades. This system is all manual trading, no automation, and not for the lazy person.
Ignored
Hi Redrobin,
The aqua lines you mentioned is the Bollinger Band I guessed but I could not see any magenta lines other than the blue and yellow which are the moving averages.
Also how do you apply the Parabolic SAR and all those horizontal dots in this system?
If you follow all my rules to the letter, you should be able to win at least 95% of your trades. This system is all manual trading, no automation, and not for the lazy person.
Ignored
I would be very careful with this kind of statement, so you traded this system 1 year as you said, and almost all of them were winners?
btw i read that ablesys switched from asctrend to abletrend ..
Please lengthen your message to at least 1 characters.
What is the purpose of the 3 light brown channel lines and how do you apply them in this system?
Thanks.
Ignored
Those lines show the main trend which give you some idea how long the immediate trend will last. If the lines are going down, then a short trade would probably last longer than a long trade. If the main trend lines are going upward, then a long trade would probably last longer than a short trade.
As far as the dots are conserned, I'm not sure how they work, they probably work about the same as the Parabolic SAR. If you need to know about Parabolic SAR (Stop And Reversal) please read about it at Babypips School.
The aqua lines you mentioned is the Bollinger Band I guessed but I could not see any magenta lines other than the blue and yellow which are the moving averages.
Also how do you apply the Parabolic SAR and all those horizontal dots in this system?
Thanks.
Ignored
I'm talking about the AQUA and MAGENTA lines INSIDE the candles. Look at the candles directly above or below the ASCTrendSig (Up or Down Arrow) signals. Those are the candles that are lighted up by ASCTrend indicating a VALID TREND to TRADE. By the way, you ARE looking at CANDLES, RIGHT??
Those lines show the main trend which give you some idea how long the immediate trend will last. If the lines are going down, then a short trade would probably last longer than a long trade. If the main trend lines are going upward, then a long trade would probably last longer than a short trade.
As far as the dots are conserned, I'm not sure how they work, they probably work about the same as the Parabolic SAR. If you need to know about Parabolic SAR (Stop And Reversal) please read about it at Babypips School.
I would be very careful with this kind of statement, so you traded this system 1 year as you said, and almost all of them were winners?
btw i read that ablesys switched from asctrend to abletrend ..
Ignored
Okay okay I see what you mean, what I really meant was that the rules I developed for this system makes it all manual trading, no automation. My rules are so strict that it's not for the lazy person, but it results in 95% wins and very good profits. The reason for the remaining 5% to probably be losses is because sometimes it's hard to distinguish REAL signals from FAKE signals.
By the say, whenever I try a new system other than my ASCTrend system, it always screws me up. But thanks for the offer.
I'm talking about the AQUA and MAGENTA lines INSIDE the candles. Look at the candles directly above or below the ASCTrendSig (Up or Down Arrow) signals. Those are the candles that are lighted up by ASCTrend indicating a VALID TREND to TRADE. By the way, you ARE looking at CANDLES, RIGHT??
Ignored
Okay thanks, finally I saw it! It is the colour of wick that pass vertically through the candle. Previuosly I was just briefly glancing at the colour of the candles and didn't expect anything to be inside there.
haha, harry , you are same as me. I am also watching the color of the candles only, until end of the day, i only realise that what redrobin has referred to is the line inside the candles.
Robin, i will try out your system, if really 95% profits, this is a good news to all. By the way, do you have any statement to show us ?
Okay thanks, finally I saw it! It is the colour of wick that pass vertically through the candle. Previuosly I was just briefly glancing at the colour of the candles and didn't expect anything to be inside there.
|
Joined Jul 2008
|
Status: Master of One
|28 Posts
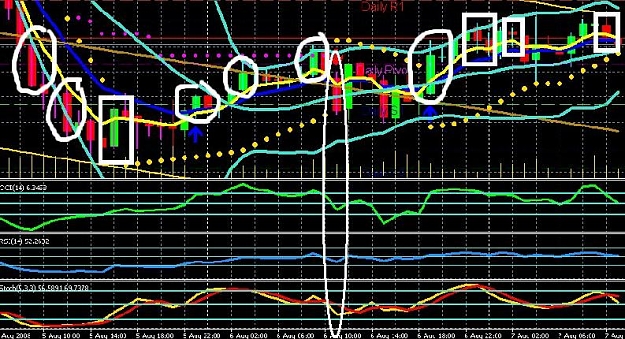
Thanks for the information and system. I am attaching a chart with a few questions...
July 17-18 on the EURUSD....looks like a slaughter. Looks like 4 consecutive trades with immediate losses - at 30pips each, that is -120 in 2 days. Now, losses are expected, but at a 95% success rate as you indicated - I just dont see that.
I am not challenging or trying to be critical. I see potential here, and believe perhaps I am not understanding the trading system as well as I should. Your entry criteria is clear, exits however are not. Bollinger bands, MA crossovers,etc...it appears very discretionary, and as most traders know, entries are no where near as important as exits.
I would appreciate if you could take some time and review the posted chart, and perhaps make comments on the entries I noted. I thank you for sharing this, and in advance for your comments.
sentinal:
I would not trade such a choppy market. But if I did, I would watch each candle very carefully, as well as all the indicators. If they show any indication of going in the opposite direction, I would close the trade immediately, therefore no losses. However, if I see another ASCTrend candle in the original direction, I might open another trade, but only 5% risk. I never set TP so I watch the candles and other indicators (CCI, RSI, and Stochs). In my opinion, I would not trade in an area where the Bollinger Bands are so constricted in that amount of time. That's common sense.
tjsun80:
YES you can enter a short trade but like I said above, watch the candles and indicators. Not all trades are big trades, ladies and gentlemen. I just try to earn the most profit under the best circumstances. Some of you act like I got a holy grail system or this is a win-win situation but that's not it at all. Not all trades are winners, not all trades are big. Earn what you can. If all you can get is 10 pips profit, so be it.
YES, you can use H4 or D1 or W1 or M1 charts. My rule about this is simple: Trade only 1-hour charts or HIGHER. Actually, the higher the time frame, the more potential your profits will be. But remember, same rules apply to all time frames H1 or higher. Anything lower than H1 is just too much noise, not much potential for big profits.
Hey Red, thanks for sharing, system looks great but lots of little details to look at. Looking back at lots of charts, it seems that the MA's are just crossing when there is an arrow. Lots to times they cross on the next candle. Many times it is the same for the other indicators. Must all the indicators be on the same candle when you take the trade, or can you wait for the indicators after the arrow?
Hey Red, thanks for sharing, system looks great but lots of little details to look at. Looking back at lots of charts, it seems that the MA's are just crossing when there is an arrow. Lots to times they cross on the next candle. Many times it is the same for the other indicators. Must all the indicators be on the same candle when you take the trade, or can you wait for the indicators after the arrow?
Ignored
The moment you enter the trade is totally up to you. I'm just showing a system that can be very profitable if used correctly, but yes you may enter after the arrow if you wish. Your trading style is your trading style.
ASCTrend1 indicator.
This indicator colors the bars according the climate of the market: red color is bearish and blue is bullish.
ASCTrend2.
Small dots (by aqua and fuchsia color) which may be used for stop or to increase the profit to the trend direction.
ASCTrend1Sig: main indicator in the system showing the signals for buy or sell. If the signal is repeated it means re-enter signal and we may open additional order on the same direction.
NRTR Line.
Trend direction indicator. Besides, we may see more strong signals from ASCTrend1Signal indicator when the price is crossing one or two lines of NRTR Line indicator, or those lines are crossing each other, or those two lines is going on the same direction.
NRTR.
Small red and green dots. It may be used to move stop loss and to estimate the market conditions as well: bearish or bullish.
NRTR WATR.
An other indicator to estimate the market conditions and to move the stops.
NRTR Colorline_my.
Very good indicator to estimate the trading zones: yellow line is bearish and white line is bullish market condition.
If we see the signals from ASCTrend1Signal indicator we should confirm it by other indicators and filters of this system.
And there is other simple trading rules:
1. Do not trade if current bar is green color.
2. Do not trade if the indicators are in contradiction between each other.
3. Do not trade when we see buy and sell signals from ASCTrend1Signal which are almost opposite each other.
4. Do not trade when the current signal bar is changing the color.
Some people say that it is the best signal system in the world.
It is very famous system and it was developed in the interesting way: Russians recognized this system for MetaTrader some years ago and this western trading system was not very profitable (I am talking about MetaTrader only) but had as great potential so Russians wanted to create the same system to be Russian system only. But they failed. They had to continue the development and improvements of this western system. They did it. Finally we have most famous trading system for Metatrader which was developed, tested, evaluated and reviewed by all forex community in the world irrespective of the barriers and countries.
Again, this ASCTrend system is FREE OF CHARGE, so it costs you NOTHING to check it out.
This system is also offered for free here and was downloaded 6489 times, as well as the template (5015 times). I have not seen any posts saying it is for SALE, or cannot be distributed for free elsewhere, nor did I ask any money for this system, all I did was change a few colors, change it to candlesticks and added a couple indicators to help find the right trend so how can it be copywright infringement? All I am showing is how I was able to adjust to to my needs and my personality. Maybe it is "exactly (down to the exact terminolgy) as a well known and respected firms work" but I really have no idea. I just found it on a forum and adjusted it to my needs accordingly. If "its from a firm that would never allow these terms or (if its there creative work) indicators to be shared for free", then why is it offered for free here? I don't see any laws broken here. If you find any proof otherwise, please present them to me now. GEEZ!! I'm just trying to help people make money. I don't need your money.