Hi,
I have never come across this type of chart before.
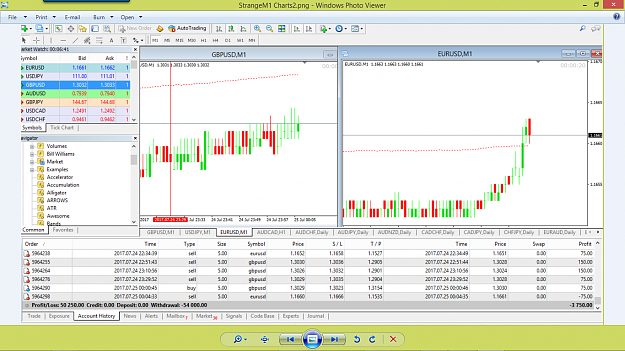
I would appreciate some of you more experienced traders to check it out and maybe give me some feedback. Very much appreciated
In particular,
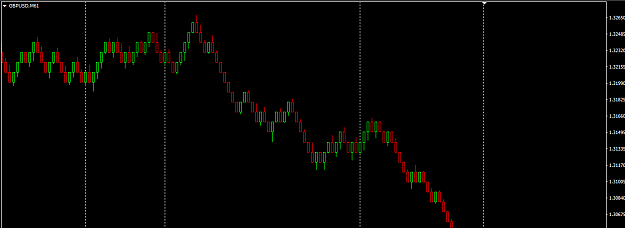
1 - The Candle formations
2 - The spread - uniform 1 pip?
3 - The lot sizes and the profits shown
4 - The open and close times of the trades - EXTREMELY SHORT TIMES?
5 - The journal page says "investor mode - trades not allowed.
6 - The withdrawal amount shown as -54,000 - can this be manipulated on a demo account, to make it appear as a live account?
Any feedback or comments would be appreciated.
Screenshot attached.
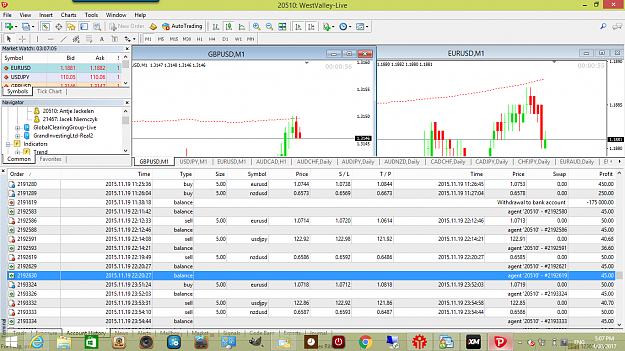
I have never come across this type of chart before.
I would appreciate some of you more experienced traders to check it out and maybe give me some feedback. Very much appreciated
In particular,
1 - The Candle formations
2 - The spread - uniform 1 pip?
3 - The lot sizes and the profits shown
4 - The open and close times of the trades - EXTREMELY SHORT TIMES?
5 - The journal page says "investor mode - trades not allowed.
6 - The withdrawal amount shown as -54,000 - can this be manipulated on a demo account, to make it appear as a live account?
Any feedback or comments would be appreciated.
Screenshot attached.
Attached Image (click to enlarge)