In this Module you are going to learn about consolidation more in depth.
The reason why you have to learn this part and I made it its own module is because the market is trending 40% of the time, which means that 60% the market will be consolidating.
What consolidation means is a period when the market stalls and has no clear directional movement. Consolidation happens in all time frames and it can happen all the time. It is also important to know that it can last as much as minutes, hours, days, weeks and even months in some cases. When markets consolidate price is not really going anywhere so you will notice that when that happens there will be NO Trading opportunities.
It is easy to spot a consolidating market because it will be moving up and down erratically. The reason why it happens is because large commercial companies and really big money trading firms begin to rollover large positions in the market, usually at the end of a large market trend. As these market players change hands (buy and sell) the extreme amounts of buying and selling create a sort of balance in the market and since they are going back and forth, there is no clear directional trend.
Above is the EUR/NZD Chart in 2011. The Market began to consolidate heavily and it lasted almost a full month and there where no trading opportunities, remember the surfer waiting for that perfect wave analogy? This is where it comes in handy and it is wiser to not trade.
Most of the time when markets consolidate a lot of traders lose most of their money, especially those traders who chase price on lower time frames and dont know how to approach the market. The market really has NO structure, big money is being moved in and out without a clear trend so it is always better to wait it out. Id rather wait as long as it takes for the market to begin to trend than to risk my money and give it back, so it is best to stay AWAY!
Just because I say stay away, doesnt mean you are not going to watch the market, it just simply means that it is not a good time to place trades. But it should alert to you that the market will eventually break out and it should still grab our attention. Be patient and keep waiting. Lets look at the chart below:
Notice how the market was consolidating and then afterwards the market broke out! That is exactly what we want to see. The reason we want to see that is because when the market breaks out for the most part the market will retrace and retest that level and THATS when we come in and watch out for Action Bar Signals, to take advantage and make money in the markets.
The chart above (NZD/USD 2010) shows another example of when the market was in a period of consolidation and when it broke out, it Retested Resistance , it became support and it formed a pin bar candle, as you can see, it would have been a good opportunity to buy and make take some profits.
MARKET SQUEEZE PATTERN TO LOOK FOR (IN A CONSOLIDATING MARKET)
This is not really a Trading Signal. Sometimes in times of consolidations, there are some obvious patterns that we want to mark on our charts and we can wait for a break out and profit.
When a Market Squeeze Pattern forms what we want to do is wait until price squeezes so much that it eventually breaks out, and here is below. This is also been known as the pennant
In this type of consolidation Squeeze Pennant Pattern price will squeeze tighter and tighter until it bursts through either the support or resistance level.
Ascending Triangle Pattern
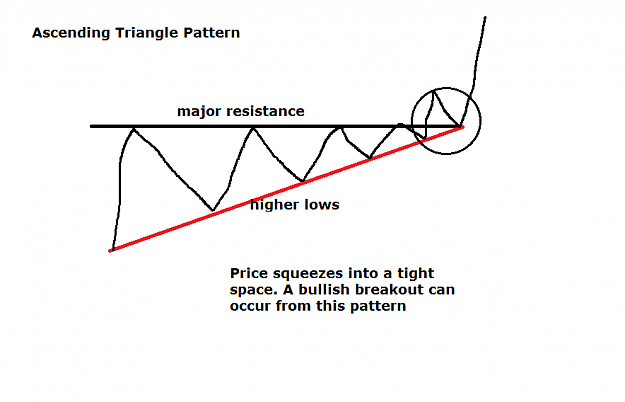
In an Ascending Triangle there is a major resistance area and it begins to form when the market creates higher lows , it is safe to say that when this type of pattern occurs it is more likely that the market will break out to the up side! The entry lies in the candle that breaks out for aggressive traders or if you want to be a more conservative trader then it is always best to wait for a Retracement followed by an Action Bar signal.
Descending Triangle Pattern
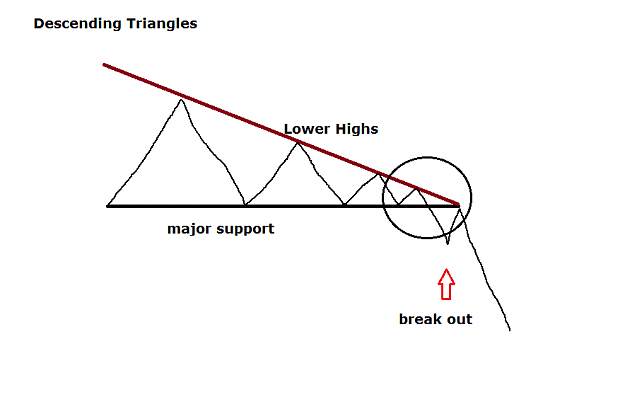
Picture above is a Descending Triangle and basically the opposite of the ascending triangles. When these patterns occur it is more likely that it will go down. As buyers try to defend their support area the sellers continue to put pressure on the buyers creating lower highs. Once it breaks out, then you prepare to place your trade.
I will now show you how to place your entry order. (see chart below):
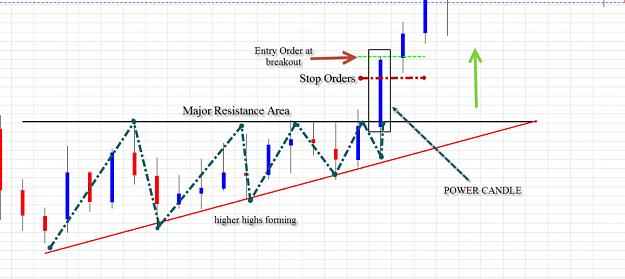
(Click picture to enlarge) As you can see above there was an ascending pattern forming and keep notice that when a breakout occurs you will get a POWER CANDLE . To enter the market, you place your orders at the break out of the power candles highest close and your stops just below the small retracement. As you can see the market did move higher and it was a successful trade.
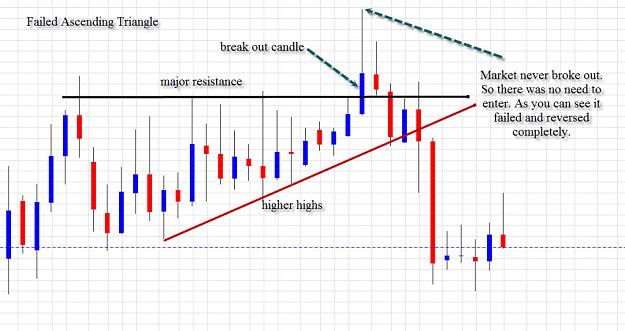
For the most part these patterns are for aggressive traders that want to take advantage and make some profits, keep in mind there will be times where the market can reverse, just like in the chart above, so take notice…. If you are conservative trader it is good to wait for a retracement and then followed by an Action Bar Signal to enter. Keep in mind that it is good to watch for these patterns because when they occur, it is more likely that we will see continuation and possibly the beginning of a strong trend.
FOREX MODULE 1 – Support & Resistance
http://www.forexfactory.com/showthread.php?t=550724
Forex MODULE 2 – BASIC MARKET Analysis - Up , Down, Sideways
http://www.forexfactory.com/showthread.php?t=550725
Forex MODULE 3 – MARKET Consolidation (MORE IN DEPTH)
http://www.forexfactory.com/showthread.php?t=550726
Forex MODULE 4 – Exponential VALUE Analysis - Daily Time Frame
http://www.forexfactory.com/showthre...28#post8400128
The reason why you have to learn this part and I made it its own module is because the market is trending 40% of the time, which means that 60% the market will be consolidating.
What consolidation means is a period when the market stalls and has no clear directional movement. Consolidation happens in all time frames and it can happen all the time. It is also important to know that it can last as much as minutes, hours, days, weeks and even months in some cases. When markets consolidate price is not really going anywhere so you will notice that when that happens there will be NO Trading opportunities.
It is easy to spot a consolidating market because it will be moving up and down erratically. The reason why it happens is because large commercial companies and really big money trading firms begin to rollover large positions in the market, usually at the end of a large market trend. As these market players change hands (buy and sell) the extreme amounts of buying and selling create a sort of balance in the market and since they are going back and forth, there is no clear directional trend.
Attached Image (click to enlarge)
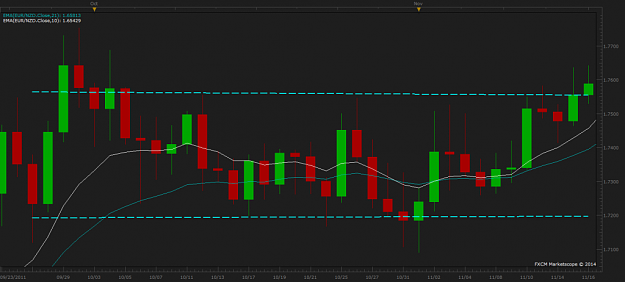
Above is the EUR/NZD Chart in 2011. The Market began to consolidate heavily and it lasted almost a full month and there where no trading opportunities, remember the surfer waiting for that perfect wave analogy? This is where it comes in handy and it is wiser to not trade.
Most of the time when markets consolidate a lot of traders lose most of their money, especially those traders who chase price on lower time frames and dont know how to approach the market. The market really has NO structure, big money is being moved in and out without a clear trend so it is always better to wait it out. Id rather wait as long as it takes for the market to begin to trend than to risk my money and give it back, so it is best to stay AWAY!
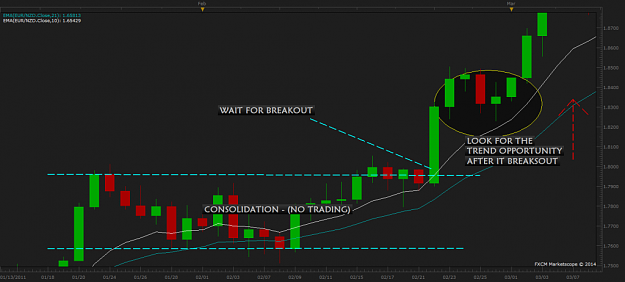
Just because I say stay away, doesnt mean you are not going to watch the market, it just simply means that it is not a good time to place trades. But it should alert to you that the market will eventually break out and it should still grab our attention. Be patient and keep waiting. Lets look at the chart below:
Attached Image (click to enlarge)
Notice how the market was consolidating and then afterwards the market broke out! That is exactly what we want to see. The reason we want to see that is because when the market breaks out for the most part the market will retrace and retest that level and THATS when we come in and watch out for Action Bar Signals, to take advantage and make money in the markets.
Attached Image (click to enlarge)
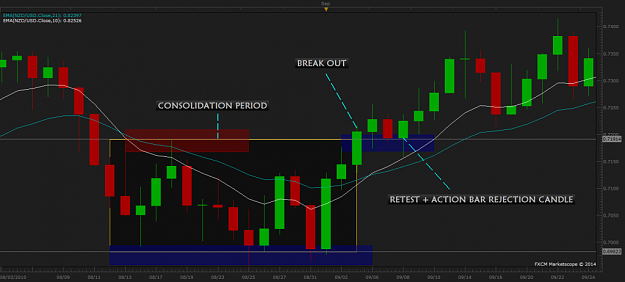
The chart above (NZD/USD 2010) shows another example of when the market was in a period of consolidation and when it broke out, it Retested Resistance , it became support and it formed a pin bar candle, as you can see, it would have been a good opportunity to buy and make take some profits.
MARKET SQUEEZE PATTERN TO LOOK FOR (IN A CONSOLIDATING MARKET)
This is not really a Trading Signal. Sometimes in times of consolidations, there are some obvious patterns that we want to mark on our charts and we can wait for a break out and profit.
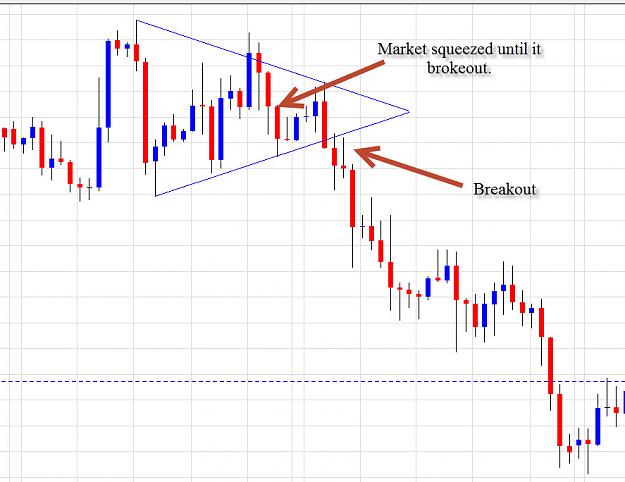
When a Market Squeeze Pattern forms what we want to do is wait until price squeezes so much that it eventually breaks out, and here is below. This is also been known as the pennant
Attached Image (click to enlarge)
In this type of consolidation Squeeze Pennant Pattern price will squeeze tighter and tighter until it bursts through either the support or resistance level.
Ascending Triangle Pattern
Attached Image (click to enlarge)
In an Ascending Triangle there is a major resistance area and it begins to form when the market creates higher lows , it is safe to say that when this type of pattern occurs it is more likely that the market will break out to the up side! The entry lies in the candle that breaks out for aggressive traders or if you want to be a more conservative trader then it is always best to wait for a Retracement followed by an Action Bar signal.
Descending Triangle Pattern
Attached Image (click to enlarge)
Picture above is a Descending Triangle and basically the opposite of the ascending triangles. When these patterns occur it is more likely that it will go down. As buyers try to defend their support area the sellers continue to put pressure on the buyers creating lower highs. Once it breaks out, then you prepare to place your trade.
I will now show you how to place your entry order. (see chart below):
Attached Image (click to enlarge)
(Click picture to enlarge) As you can see above there was an ascending pattern forming and keep notice that when a breakout occurs you will get a POWER CANDLE . To enter the market, you place your orders at the break out of the power candles highest close and your stops just below the small retracement. As you can see the market did move higher and it was a successful trade.
Attached Image (click to enlarge)
For the most part these patterns are for aggressive traders that want to take advantage and make some profits, keep in mind there will be times where the market can reverse, just like in the chart above, so take notice…. If you are conservative trader it is good to wait for a retracement and then followed by an Action Bar Signal to enter. Keep in mind that it is good to watch for these patterns because when they occur, it is more likely that we will see continuation and possibly the beginning of a strong trend.
FOREX MODULE 1 – Support & Resistance
http://www.forexfactory.com/showthread.php?t=550724
Forex MODULE 2 – BASIC MARKET Analysis - Up , Down, Sideways
http://www.forexfactory.com/showthread.php?t=550725
Forex MODULE 3 – MARKET Consolidation (MORE IN DEPTH)
http://www.forexfactory.com/showthread.php?t=550726
Forex MODULE 4 – Exponential VALUE Analysis - Daily Time Frame
http://www.forexfactory.com/showthre...28#post8400128