What is support and Resistance ?

When the market moves up and then pulls back, the highest point reached before it pulled back is now resistance. As the market continues up again, the lowest point reached before it started back is now support. In this way resistance and support are continually formed as the market oscillates over time. The reverse is true for the downtrend. Lets look at another Chart with Support & Resistance Plotted:
DRAWING SUPPORT & RESISTANCE
Support & Resistance will be the core foundation of any trading system. Even guys that are into fundamental trading are always drawing their support and resistance lines and are looking for support and resistance areas long with lining that up with economic news data. Obviously we are Technical Analysis traders and will not be getting into that BS economic news stuff. Is it important to know for yourself interest? Sure it is, but when it comes to making money in the markets, it just doesnt matter.

The trader and chart above demonstrates a trader who drew horizontal lines across every single peak, every swing high and swing low . There really is no reason to go overboard and start drawing support and resistance lines like crazy, your charts will then look like an abstract drawing like, and we dont want that, because thats confusing.
KEEP IT SIMPLE STUPID (KISS)
As a Technical Analysis trader you must learn to keep the charts as SIMPLE and as CLEAN as Possible! Just follow the core movements of the market and dont bombard the chart with 10-20 different support and Resistance levels.
The way we are going to be drawing support and resistance is going to be from the Daily Charts and the Weekly charts. Drawing out the Daily and Weekly Support and Resistance correctly will be another crucial skill that is needed. Because the Action Bar Strategies that you are going to learn occur when price is near a Support or a Resistance Level. Not just that, but you will also notice that in higher time frames such as the Daily & Weekly there is a much higher success rate that the market WILL respect that level and a higher chance of success a signal will form, giving us the opportunity to enter the market and profit.
When Plotting Support and Resistance levels there is no need to know any type of math or science bs. It only requires a little bit of attention and perception on your behalf. It leans more toward resembling an art form, you will probably will not get it straight away, but with continued screen time and constant practice, you will get better at it. Some people will get it fast and others will not, keep in mind that either way Trading is a skill that can be learned just like any other skill, with persistence and effort, so do not be surprise if you can not master it in one day. Now, Lets look at a chart example where the market found resistance and created support & vice-versa:
Are you getting the hang of it? Dont worry this skill is easy and as long as you continue practicing at plotting the levels the easier it will get. What I want you to really take note is that the key turning points of the market, where old support levels have held as key resistance points and vice-versa. Now I would want you to zoom out to where you can no longer see the candle sticks, give yourself at least 1 to 2 months so that you can see the most obvious support and resistance that are currently holding and forming around the current price movement.
So remember Focus on the Key levels the market has recently respected!
I also want you to keep in mind that Support and Resistance Levels change constantly as time goes on. So eventually you will have to adapt to the current market conditions and continue to plot new levels that the market creates. So dont get stuck with the mindset that support and resistance levels are concrete, YOU MUST keep up with what is going on in the markets.
This will be a process of getting the hang of, but I will be with you every step of the way. I know it may be all too overwhelming, It is kinda like when you first started driving, I am pretty sure at one point you actually had to be aware of opening the door, closing the door, getting yourself seated, thinking about putting on your seat belt, thinking about how your side mirrors and back mirrors are, also thinking about turning the key so that the car can start, while you have your foot on the break. (Thats just a start) You have to know if it is an Automatic then put it on (Drive) if it is a manual, then you had to be sure to put it on 1st and as you are going to have to release the clutch and simultaneously press on the accelerator so that the car can go forward As you begin to move you have to be aware of your surroundings, like other cars, the streets, the people, the signs, be aware of street lights or else you can get into an accident or better yet get lost. and now after a good year or two of driving or more I bet you dont even bother to pay attention to those things because it is all automatic like breathing! Well that is how trading is, so eventually you will get to that POINT! Practice, Practice, Practice!!!!
Hope you guys enjoy!!!
FOREX MODULE 1 – Support & Resistance
http://www.forexfactory.com/showthread.php?t=550724
Forex MODULE 2 – BASIC MARKET Analysis - Up , Down, Sideways
http://www.forexfactory.com/showthread.php?t=550725
Forex MODULE 3 – MARKET Consolidation (MORE IN DEPTH)
http://www.forexfactory.com/showthread.php?t=550726
Forex MODULE 4 – Exponential VALUE Analysis - Daily Time Frame
http://www.forexfactory.com/showthre...28#post8400128
Attached Image
When the market moves up and then pulls back, the highest point reached before it pulled back is now resistance. As the market continues up again, the lowest point reached before it started back is now support. In this way resistance and support are continually formed as the market oscillates over time. The reverse is true for the downtrend. Lets look at another Chart with Support & Resistance Plotted:
Attached Image (click to enlarge)
QuoteDislikedNotes about support and resistance:
When the price passes through resistance, that resistance could potentially become support.The more often price tests a level of resistance or support without breaking it, the stronger the area of resistance or support is. When a support or resistance level breaks, the strength of the follow-through move depends on how strongly the broken support or resistance had been holding.
DRAWING SUPPORT & RESISTANCE
Support & Resistance will be the core foundation of any trading system. Even guys that are into fundamental trading are always drawing their support and resistance lines and are looking for support and resistance areas long with lining that up with economic news data. Obviously we are Technical Analysis traders and will not be getting into that BS economic news stuff. Is it important to know for yourself interest? Sure it is, but when it comes to making money in the markets, it just doesnt matter.
Attached Image
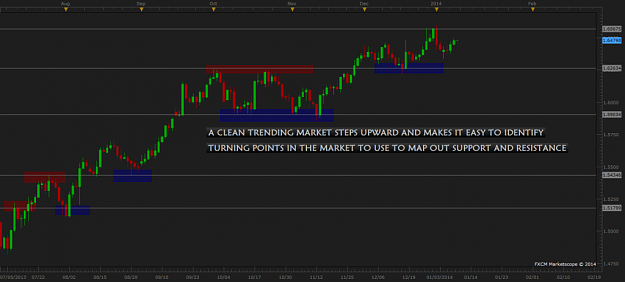
The trader and chart above demonstrates a trader who drew horizontal lines across every single peak, every swing high and swing low . There really is no reason to go overboard and start drawing support and resistance lines like crazy, your charts will then look like an abstract drawing like, and we dont want that, because thats confusing.
KEEP IT SIMPLE STUPID (KISS)
As a Technical Analysis trader you must learn to keep the charts as SIMPLE and as CLEAN as Possible! Just follow the core movements of the market and dont bombard the chart with 10-20 different support and Resistance levels.
The way we are going to be drawing support and resistance is going to be from the Daily Charts and the Weekly charts. Drawing out the Daily and Weekly Support and Resistance correctly will be another crucial skill that is needed. Because the Action Bar Strategies that you are going to learn occur when price is near a Support or a Resistance Level. Not just that, but you will also notice that in higher time frames such as the Daily & Weekly there is a much higher success rate that the market WILL respect that level and a higher chance of success a signal will form, giving us the opportunity to enter the market and profit.
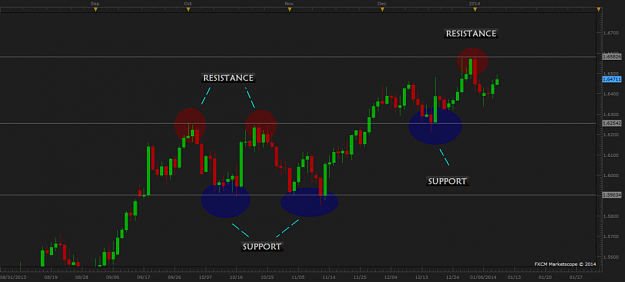
When Plotting Support and Resistance levels there is no need to know any type of math or science bs. It only requires a little bit of attention and perception on your behalf. It leans more toward resembling an art form, you will probably will not get it straight away, but with continued screen time and constant practice, you will get better at it. Some people will get it fast and others will not, keep in mind that either way Trading is a skill that can be learned just like any other skill, with persistence and effort, so do not be surprise if you can not master it in one day. Now, Lets look at a chart example where the market found resistance and created support & vice-versa:
Attached Image (click to enlarge)
RED = RESISTANCE
BLUE = SUPPORT
QuoteDislikedNote: In example above, we have five S/R levels marked out (The Horizontal Lines), but this is only to demonstrate the key levels within this trend. Normally, we wouldnt have so many levels marked at once. Marking out too many support and resistance levels at the same time makes the chart too busy, and is unnecessary.
IMPORTANT TIP: In a real live analysis of the market you really only want to have 1 or 2 horizontal lines that are marking out obvious support and resistance levels.
Attached Image (click to enlarge)
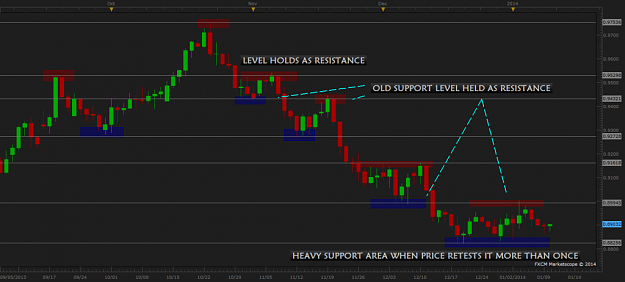
Are you getting the hang of it? Dont worry this skill is easy and as long as you continue practicing at plotting the levels the easier it will get. What I want you to really take note is that the key turning points of the market, where old support levels have held as key resistance points and vice-versa. Now I would want you to zoom out to where you can no longer see the candle sticks, give yourself at least 1 to 2 months so that you can see the most obvious support and resistance that are currently holding and forming around the current price movement.
So remember Focus on the Key levels the market has recently respected!
I also want you to keep in mind that Support and Resistance Levels change constantly as time goes on. So eventually you will have to adapt to the current market conditions and continue to plot new levels that the market creates. So dont get stuck with the mindset that support and resistance levels are concrete, YOU MUST keep up with what is going on in the markets.
This will be a process of getting the hang of, but I will be with you every step of the way. I know it may be all too overwhelming, It is kinda like when you first started driving, I am pretty sure at one point you actually had to be aware of opening the door, closing the door, getting yourself seated, thinking about putting on your seat belt, thinking about how your side mirrors and back mirrors are, also thinking about turning the key so that the car can start, while you have your foot on the break. (Thats just a start) You have to know if it is an Automatic then put it on (Drive) if it is a manual, then you had to be sure to put it on 1st and as you are going to have to release the clutch and simultaneously press on the accelerator so that the car can go forward As you begin to move you have to be aware of your surroundings, like other cars, the streets, the people, the signs, be aware of street lights or else you can get into an accident or better yet get lost. and now after a good year or two of driving or more I bet you dont even bother to pay attention to those things because it is all automatic like breathing! Well that is how trading is, so eventually you will get to that POINT! Practice, Practice, Practice!!!!
Hope you guys enjoy!!!
FOREX MODULE 1 – Support & Resistance
http://www.forexfactory.com/showthread.php?t=550724
Forex MODULE 2 – BASIC MARKET Analysis - Up , Down, Sideways
http://www.forexfactory.com/showthread.php?t=550725
Forex MODULE 3 – MARKET Consolidation (MORE IN DEPTH)
http://www.forexfactory.com/showthread.php?t=550726
Forex MODULE 4 – Exponential VALUE Analysis - Daily Time Frame
http://www.forexfactory.com/showthre...28#post8400128
Attached Image
