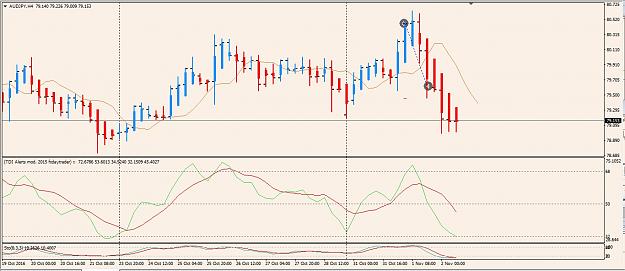
Disliked{quote} Hi Emm, Thank you for the comments. I have changed my settings and indeed my indicator shows only one MC (3) on my chart in that congested area. I hope this is same with one you can see without indicator. See attached chart. I have some questions on MC. I have pointed the MC(3) with a down arrow on my chart. After MC(3), there were several fake breakouts (with stop signs) but all closed with the MC range. Then there was a breakout (yes sign) that closed lower than MC low which would have signaled good for short, but we know now that was...Ignored
Hi okoso.
You are too engrossed in one MC[3] and stopped looking at the changing market condition , candle by candle following that one MC[3]. Look at the overall price action, zoom out and zoom in as often as you have time for, look at the bigger picture especially after that Brexit June 26. There is psych levels 1.6100. The market is now in what elliot waves experts see as an expanding triangle forming. The EW practitioners are looking at break of the expanding triangle when that is complete. There is fear and greed.
Remember, we can harness on the fear and greed of the market when we know what investors like Warren Buffet believes in:
Be Fearful When Others Are Greedy and Greedy When Others Are Fearful
We trade with the best price we get into the market. One single entry is never the best price you will get into the market.
The best price is the price which is closest to your initial stop loss. The next best price is the average price of several entries from your initial stop loss.
Now back to your chart and questions:
In my previous posts on the use of Master Candle MC to identify potential market consolidation and range trading, I did mention that there are different MCs.
MC[5] is one which many other trading systems uses. MC[5] is a master candle which high-low engulf the next 5 consecutive candles high-low.
MC[4] is a master candle which engulfs the next 4 consecutive candles high low.
In the TMS-II development project by a group of active TMS traders, we found that the frequency of MC[3] on our charts is the highest compared to MC[4] and MC[5].
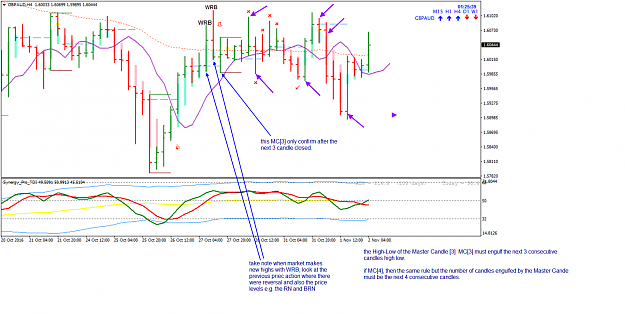
There is no rule on how many candles after a MC[3] to use for a breakout. What is important is the high-low range of the MC[3] and we look at the high-low of the MC[3] as support and resistance. We can trade the lower timeframe after we confirm a MC[3], i.e. if we see a H4 MC[3], we can trade either H1 or M15 using the MC[3] high-low as support and resistance.
We simply do not trade that timeframe when the market is in consolidation in that particular timeframe. This is also one of Big E’ several trading rule.
Also must take note that MC can also lose it purpose when there are other candles following it. For example, after a MC[3], there can be new Wide Range Bar or other big candles which tells us the prevailing market condition.
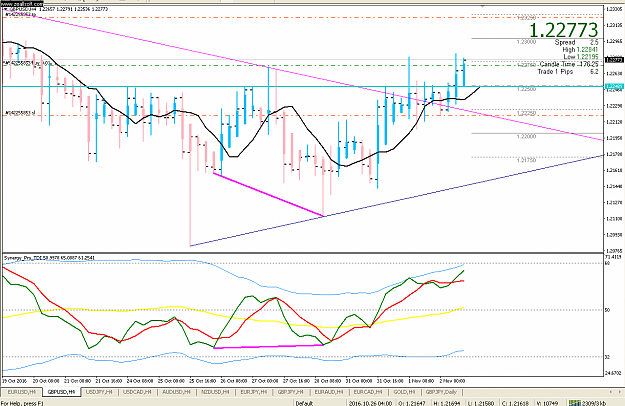
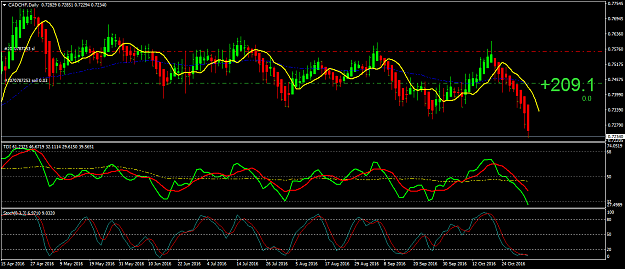
The problem with that GBPAUD H4 chart is not just the WRB and the MC[3] and the breakouts after that consolidation range. There is a ‘problem’ this week which you
can see only in the W1 and D1 chart reconciliation. Look carefully at the week 43 W1 candle and the D1 candles of that same week.
Do you know what is that type of W1 candle? Learn from strat's thread.
Attached Image (click to enlarge)
Trade Well.
Honesty is a very expensive gift. You wont find it in cheap people.WBuffett
2