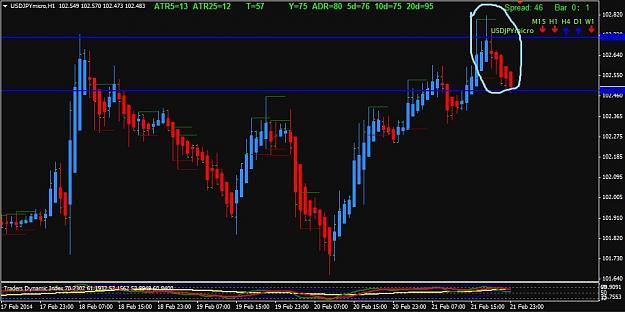
I know these under various other names 'kangaroo tails' or pinbars, and on lower time frame charts will look like 'tweezer tops' and bottoms. Also note the creation of new supply and demand zones.
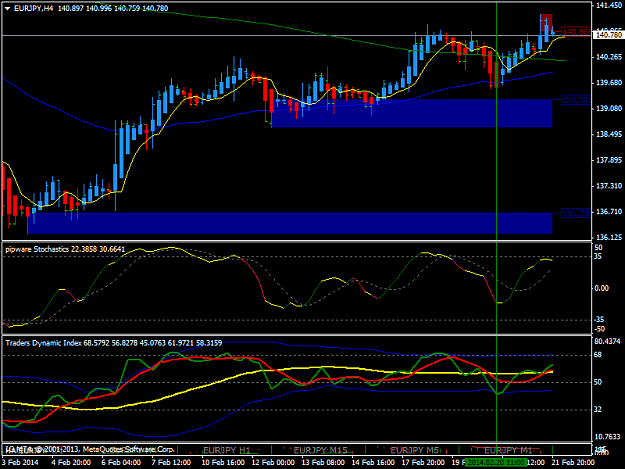
I also like to have 100/200 MA's on my chart. On this EJ H4 chart we see pin bar reversals along the 100 MA and along a demand zone
I also like to have 100/200 MA's on my chart. On this EJ H4 chart we see pin bar reversals along the 100 MA and along a demand zone
Attached Image (click to enlarge)