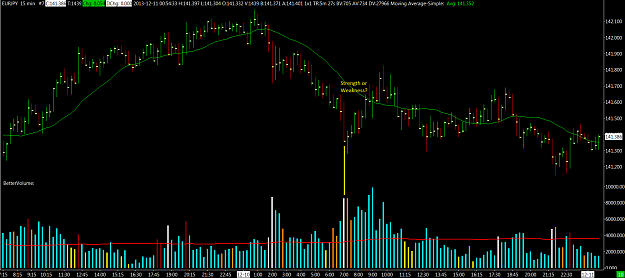
Some weakness as it closes on the low, but it is into a demand zone so there is also strength coming in as buying occuring as high volume is seen and the next bar confirms strength as a narrow range up bar closing higher on same volume level, the market moves up on this temporary strength but after a few NS ND bars the market continues downwards. Buying seen at support levels on the lows.
Some weakness as it closes on the low, but it is into a demand zone so there is also strength coming in as buying occuring as high volume is seen and the next bar confirms strength as a narrow range up bar closing higher on same volume level, the market moves up on this temporary strength but after a few NS ND bars the market continues downwards. Buying seen at support levels on the lows. {quote}
Ignored
From a market analyst point of view you are right.. But I was more looking at it from a trader's point of view.
Let me ask it this way, with only seeing this, are you looking to buy, sell or stay on the sidelines? And why?
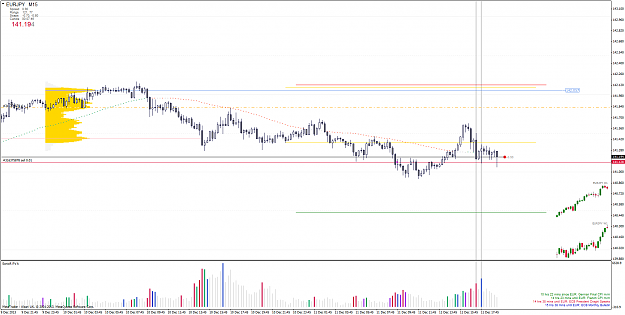
Does this bar make you think Strength or Weakness? {image}
Ignored
Stregnth comes in but it does not seems to be enough to stop the down trend. We see that weakness appears later in 2,5 hours. That means we had opened a long entry agains the trend, we should exit our position as soon as weakness has appeared.
{quote} Stregnth comes in but it does not seems to be enough to stop the down trend. We see that weakness appears later in 2,5 hours. That means we had opened a long entry agains the trend, we should exit our position as soon as weakness has appeared.
Ignored
Edit: my comment was after seeing the fact. If I was trading this pair, I would not go long. Even if it shows strength, it does not give me a VSA setup to enter after a NS bar.
Yes, it does show some NS bars but they come after we have seen weakness around 141,600. That weakness at 9 o'clock would keep me out to enter on any NS bar between 15.00-17.30 o'clock.
{quote} From a market analyst point of view you are right.. But I was more looking at it from a trader's point of view. Let me ask it this way, with only seeing this, are you looking to buy, sell or stay on the sidelines? And why? {image}
Ignored
With only seeing this, I would wait and stay on the sidelines untill I see a test or NS bar to enter a long entry.
Does this bar make you think Strength or Weakness? {image}
Ignored
It could be strength. If you consider next bar being some sort of test it has too much volume for going long. Rather not. I would but I'm no ordinary trader Better wait low volume test into same area and then long.
{quote} Let me ask it this way, with only seeing this, are you looking to buy, sell or stay on the sidelines? And why? {image}
Ignored
Thanks SimpleDev for your feedback, I would have bought at the close of the last candle because of the high volume buying on this and the previous candle, also looking to the left we can see price is at a demand zone and important support area. Even though we have weakness in the background, we have strength also so I would be monitoring the trade closely and at the first sign of weakness such as an upthrust or *No Demand etc I would more than likely take profit and/or place a reversal trade short. Alternatively being a bit mroe conservative I would wait on the sidelines and maybe look to enter short on more weakness revealing itself as a confirmed ND bar around a falling trendline. Also I would need to look at several timeframes to consider the bigger picture and ideally trade with the trend.
{quote} It could be strength. If you consider next bar being some sort of test it has too much volume for going long. Rather not. I would but I'm no ordinary trader Better wait low volume test into same area and then long.
Ignored
Aldo is my hero!
If Aldo enters into a position and the market goes against him, the market has to stop and correct itself.. Because it was the market who was wrong, not him.
Does this bar make you think Strength or Weakness? {image}
Ignored
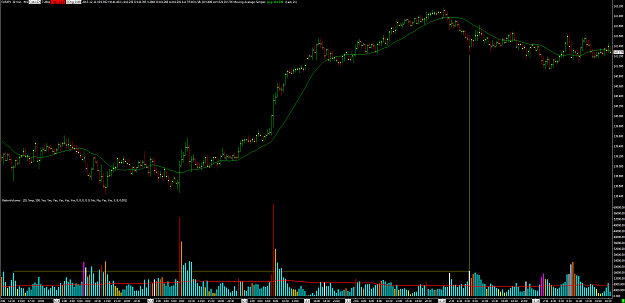
I see this as weakness.
Selling does occur on high volume down bars.. The close of that bar was on its low, I'd rather wait for a down bar with high volume and a close towards the middle to label it as strength.
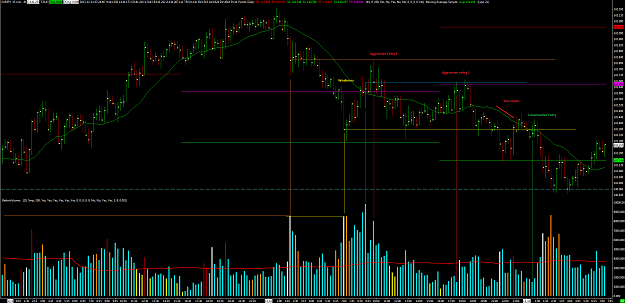
Take a look at the orange bar from London, it has higher volume than the bar in question and yet the market pushed below this bar, telling me that its a weak market. Once the weak bar printed I would be looking for shorts, not longs. The highest volume bar for yesterday, in blue, looks like it could be a shake out, but it if it was strength you would expect it to be around the same level as the weak bar, the market would have bought at the lows, rather than up high. Asia came around and rejected the high of this bar, always a good idea to mark your trigger numbers off the highest volume bar from the day before.
There are two aggressive entries and one conservative. I wasn't around for the first aggressive entry the second I passed and took the conservative down to the whole number 141. The reason why I am calling the entry conservative, or safer entry, is because it is below the low of the weak bar confirming it was indeed selling.
{quote} I see this as weakness. Selling does occur on high volume down bars.. The close of that bar was on its low, I'd rather wait for a down bar with high volume and a close towards the middle to label it as strength. Take a look at the orange bar from London, it has higher volume than the bar in question and yet the market pushed below this bar, telling me that its a weak market. Once the weak bar printed I would be looking for shorts, not longs. The highest volume bar for yesterday, in blue, looks like it could be a shake out, but it if it was...
Ignored
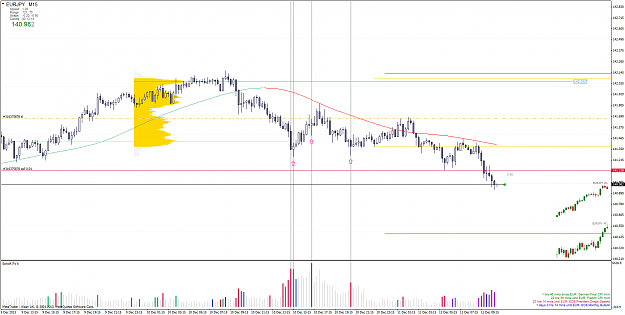
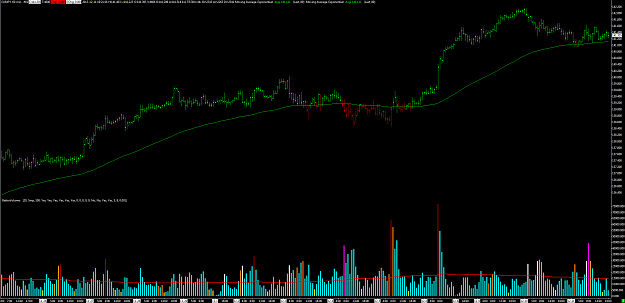
if we have a look at the same pair on a 30M chart, then that bar showing "weakness", would be show strength since it is closing towards the middle with high volume.
I agree with you on your 15min chart explanation and really impressed. How can we manage such a situation, when looking at 15M showing weakness, on 30M showing strength ?
{quote} I see this as weakness. Selling does occur on high volume down bars.. The close of that bar was on its low, I'd rather wait for a down bar with high volume and a close towards the middle to label it as strength. Take a look at the orange bar from London, it has higher volume than the bar in question and yet the market pushed below this bar, telling me that its a weak market. Once the weak bar printed I would be looking for shorts, not longs. The highest volume bar for yesterday, in blue, looks like it could be a shake out, but it if it was...
Ignored
Very apreciated SimpleDev , relly interesting. Why do you use M15 (I use H1)? I try to learn vsa, thanks
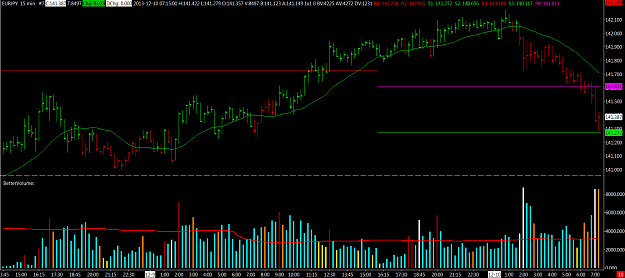
Now I have my short trade opened. The 1st candle say me weakness, because volume and close, and no volume next candle. The 2nd candle (gratest volume) I think not bulls, because it wasn't at 141.000 and not close above highs. What do you thik? Thanks
{quote} How can we manage such a situation, when looking at 15M showing weakness, on 30M showing strength ?
Ignored
Stay out, especially when you are first starting out do everything you can to stack the odds in your favor.
A great thing about forex is the leverage, you can still make 10-15% monthly return with only 3 or 4 trades a month.
The 30m chart, volume about average, I want to see volume higher than the previous 3 or 4 days for 30m/1h charts before I would consider it strength or weakness. So in this case I would ignore the bar.
{quote} Very apreciated SimpleDev , relly interesting. Why do you use M15 (I use H1)? I try to learn vsa, thanks Now I have my short trade opened. The 1st candle say me weakness, because volume and close, and no volume next candle. The 2nd candle (gratest volume) I think not bulls, because it wasn't at 141.000 and not close above highs. What do you thik? Thanks {image}
Ignored
I use every time frame available to me.
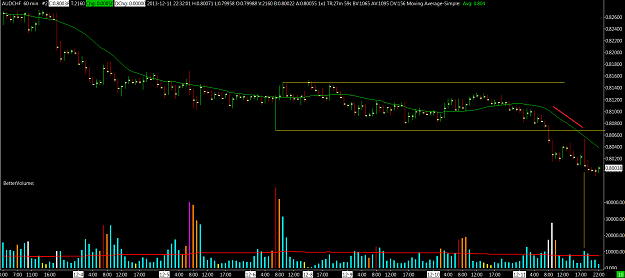
I would be hesitant with a short right now. I like to use a 89 EMA on a 1h and 4h charts, on those TFs 89 EMA can be a tough area to break, I exited my short yesterday because of this, and I would not consider shorting until we break this area.
{quote} Hi SipleDev, I think we have a mixed background of a ranging market. I see signs of strength and weekness very close to each other. We have seen heavy buying at 0,81150 and heavy selling 0,81400. It seems for me merely like the price will continue down because there are many failing tests. I would wait for a down move, then a retracement to short after SOW and a ND bar to short.