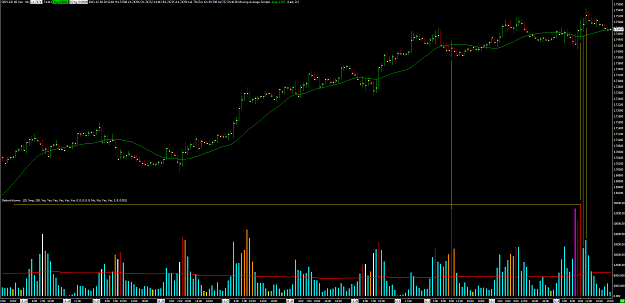
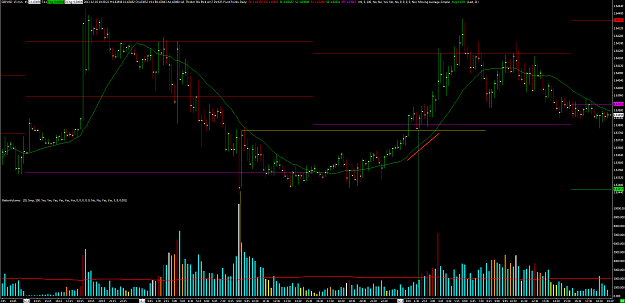
Carbonando, Looking at the background I see your blue rectangle runs into a UHV 2bar reversal area. There is a lot of volume in that "effort to rise" which I interpret as a high cost intervention. Above, at the top supply enters into the market & after distribution it takes effect.. If you were running a P&F chart you would be able to calculate the "weight" of that distribution. There was strong "effort to fall" or bearish push down. There could be elements of demand in that wide bar down with UHV, but how to find out? Looking at that UHV SO bar gives us a clue. Look at where it appears, at the top of a minor retrace. To my way of thinking that is major supply still in the market, & will be taken out in time. Sure, there is a low vol SO bar checking its base & moved the market up, you probably did your entry off that bar. I would wait for additional strength to appear in this area before I would get interested in going long... I do not see it atm... so this would probably fizzle out & perhaps go sideways with a minor retrace.. lets see how we go
- Post #24,982
- Quote
- Dec 3, 2013 5:38pm Dec 3, 2013 5:38pm
- | Membership Revoked | Joined May 2008 | 3,395 Posts
The Market pays you to be disciplined

- Post #24,992
- Quote
- Dec 4, 2013 3:51pm Dec 4, 2013 3:51pm
- | Membership Revoked | Joined May 2008 | 3,395 Posts
The Market pays you to be disciplined
- Post #24,993
- Quote
- Dec 4, 2013 3:59pm Dec 4, 2013 3:59pm
- Joined Jul 2007 | Status: Member | 17,793 Posts
COT: The precious data ignored