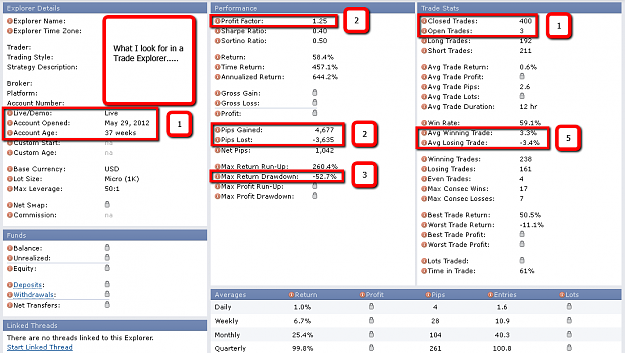
What I look for in a Trade Explorer
Somebody suggested a post on this topic, and I couldn’t resist giving it a shot. My comments are based on a hypothetical scenario: what would I look for in a TE, if I was considering having the TE’s creator trade my money on my behalf.
First, it’s important to define one’s desired performance agenda. For me, it’s steady long-term account growth with tight control on risk, and my priorities are set accordingly. (For others, it might be to start with a $100 account, the loss of which they can easily shrug off, and use maximum available leverage in the hope of turning it into $100,000 as quickly as possible. For still others, it might be the guaranteed recovery offered by a martingale variant, because they are willing to wear the risk of sudden and unexpected loss of the entire account, at any future point. In short, forex is an open-ended vehicle that allows plenty of different speculative strokes for different folks).
The numbered points correlate with the numbers in my attached screenshot.
1. Statistical validity: This is the first thing that I look for. Given my long-term agenda, I like to see an absolute minimum of a 12 month, 500+ trade, track record, on a live account, and preferably a lot more. Anything significantly shorter than this is unlikely to be indicative of future performance, i.e. could be written off as “beginner’s (good or bad) luck”. Time is more important than number of trades, in that I believe it's important to demonstrate survival across as many different market conditions as possible. (However, offsetting this a little, I also understand that markets can 'evolve' over time [some possible reasons: economic, technological, trader belief/behavioral shifts], which means that distantly historical performance runs the risk of being unrepresentative of current market conditions).
Statistical longevity is important for two other reasons:
(i) many systems can be propped up for a long time by MM that is ultimately unsustainable, e.g. martingale variants; or otherwise rely on some kind of mean reversion, i.e. counting on open losses to recover, that will eventually be tested by 'black swan' or 'fat tail' moves; and
(ii) it is easier than many folk realise to be 'fooled by randomness', as is explained very well here.
Of course I realize that FF’s TE hasn’t yet been around for long enough to allow for track records of a decent size.
2. Profit factor: I once read an article in which a famous trader (it was Paul Tudor Jones, if I recall correctly) said that he could count on the fingers of one hand, the number of traders he knew personally that, over their entire career, had been able to maintain a PF>2. Hence, even allowing for the fact that retail traders have the advantage of agility, whenever I see a PF>2, I think something like “well either
(a) this guy is well on his way to becoming a multi-millionaire, or
(b) he’s employing some unsustainable MM, or
(c) if he doesn’t meet the criteria in point 1, then he’s been lucky so far”.
Any EA with a PF>2 almost certainly fits into category (b) or (c). If it seems too good to be true.......
IMO a better PF is obtained by dividing the profit pips by the loss pips. That cuts MM (point (b)) out of the equation. As I’ve posted many times before, MM can ultimately never rescue a trader/system whose entries/exits fail to attain positive expectancy. Trade expectancy determines whether your equity curve points upward or downward, and MM (position sizing) determines the steepness of its gradient. Increase position size and you increase return and risk in like proportion. In this post I illustrate how it’s possible to turn a 30% per annum return into 900%, by merely using MM and increasing trade & compounding frequency. If a trader/system has attained a pip-based PF>1.5 over more than 2 years, and 1,000+ trades, then that’s a symptom of a very proficient trader, IMO.
One very important point: PF must include open trades, i.e. unrealized P/L. A number of traders, instead of applying a formal loss exit strategy, leave trades open until they return to profit (or, even worse, average their losers). Unrealized gains and losses form a very real part of the available balance in a trading account.
3. Maximal drawdown: this is essentially the product of MM and risk management. If it has been allowed to reach > 30%, then the trader/system is sizing too aggressively for my personal liking. But, having said that, everybody’s appetite for risk is different. Remember that, if you’re using fixed fractional sizing (compounding your equity growth, by risking X% per trade), when your account is Y% in drawdown, it requires a gain of (100 x Y)/(100 – Y) percent to return to breakeven. For example, if your account is 20% in drawdown, it requires a (100x20)/(100–20) = a 25% gain on the remaining capital to return to BE. Hence the more you let drawdown run away from you, the more irretrievable it becomes.
In addition to this problem, risk of ruin increases geometrically when position size is increased. For example, if you double your trade risk from (say) 2% to 4%, your risk of ruin — however small it might be — is nonetheless more than doubled.
In general, risking the textbook 1%–2% per trade should keep you out of trouble; at least it will afford you some time to study your system performance, and if necessary, revise and overhaul your system, before drawdown gets completely out of control. However, if the trader/system has an exceptional win rate, then there may be reason to justify an increase beyond 2%. The table attached to this post gives the probability of attaining X consecutive losses over the course of 50 trades, for a given win rate. However, keep in mind that the table assumes 1:1 RR trades, and also does not take into account losing sequences that contain occasional wins, e.g. L– L– L– L– L– W– L– L– L– L has only 5 consecutive losses, but the losses exceed the wins by 8. Again, what constitutes acceptable or unacceptable drawdown is a personal decision, and it may be worthwhile to run some kind of Monte Carlo-type analysis (assuming that you have enough historical performance data) to gain some kind of feel for your optimal position size.
One final point: some traders don’t have all of their trading capital deposited with the broker, hence a X% drawdown in the account may be significantly less than a X% drawdown overall. (Obviously it’s only necessary to keep enough money in the account to avoid a margin call; the rest may be deployed safely elsewhere).
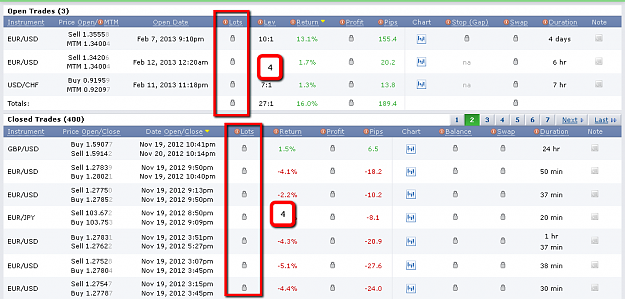
4. Lots per trade: I look at a breakdown of the individual trades, both for the use of stoplosses (alas, FF’s TE doesn’t show these), and unduly large variations in the lot sizes used. Large variations in size is a big red flag to me. Formal stoplosses aren’t essential, but if they’re not there, it’s impossible to determine what kind of loss exit strategy (if any) the trader is employing. If there are signs of averaging down, or (even worse) doubling down, then that’s the biggest red flag of all, IMO. Obvious signs of ‘hedges’, baskets and/or recovery/rescue trading are also a big turn-off for me, as they provide no real edge, and suggest that the trader lacks a basic understanding of trading math.
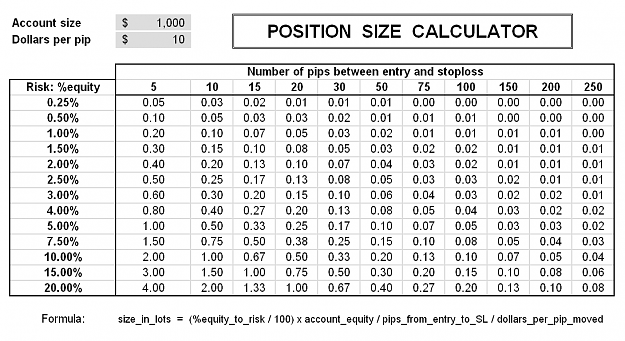
I work on a basic rule of thumb of 1 full lot per $25,000 in the account (scaled proportionally according to the account size). That equates to approximately 2% risk with a 50 pip stoploss. If position sizes are significantly larger than this, then I start to question the level of risk that's being taken. (See the XLS/image below: for example, at 2% risk and a 50 pip SL, you may trade 0.04 lots for every $1,000 in your account).
I also look at the largest losses in the account, percent-wise. Again, each loss should be no greater than 2% of the account balance, unless there are valid reasons for taking greater risk (e.g. an exceptionally high win rate).
5. Average win size divided by average loss size, preferably in pips. Most profitable traders/systems end up with a career RR>1, i.e. they win more on winning trades than they lose on losing trades. Hence a value > 1 is a healthy, but not necessarily essential.
I also compare the loss sizes (percent) with the win sizes (percent). A consistent highest %loss usually means that formal SLs are being used, which is good risk management IMO. And again, the loss sizes should, on average, be less than the win sizes, which is an indication of a healthy RR.
Finally, I check the winning trades (in pips) against the trade time. If there are many small wins (e.g. < 5 pips) for trades that have been open for several hours, this suggests that the trader might be playing some kind of recovery strategy, i.e. leaving trades in loss until they return to breakeven, a dangerous strategy that lacks 'cut losses' risk management. I'll open up the charts of such trades, to see how far they were allowed to proceed into drawdown; if the worst case is several times the size of the average winning trade (in pips), then that's another red flag.
For me, those are the “big five” criteria. The Sharpe and Sortino ratios give a measure of the consistency of monthly returns (higher values indicate greater consistency), but these are secondary, only after one has attained some evidence of positive expectancy.
Balances and percentages are much less important to me. These are the figures that attract newcomers to forex, but they can be easily skewed, not only by MM, but also by deposits and withdrawals from the account. With leverage and some luck, almost anything is possible — in the short term.
I’ll add to this post when I get some more time. But that’s enough for starters. I expect that it will provoke some interesting comment.
David
___________________________
UPDATE - Feb 5, 2018
A couple of points, in addition to the above:
#1. I prefer qualitative evidence to quantitative. In other words, I'd want to understand how a money manager's trading strategy works: what his 'edge' is, (especially) how he manages risk, and satisfy myself that he's fully conversant with the process of trading; in addition to seeing a performance history. There is always the possibility that TEs or myfxbooks can be faked or manipulated, or the results propped up by unsustainable MM (e.g. martingale variants; adding to losses) that will eventually fail, or some other ruse.
#2. I would NEVER allow a trader to manage my money unless:
He met the requirements of everything stated in point #1;
He provided evidence that he was both fully accredited, and regulated, by the relevant governing authorities in his country;
I knew the physical address of his operation;
I'd seen some kind of third-party verified performance history showing consistent results over several years' worth of changing markets;
The funds were held in a segregated account, in my name, and he merely had limited POA allowing him to trade on my behalf.
Somebody suggested a post on this topic, and I couldn’t resist giving it a shot. My comments are based on a hypothetical scenario: what would I look for in a TE, if I was considering having the TE’s creator trade my money on my behalf.
First, it’s important to define one’s desired performance agenda. For me, it’s steady long-term account growth with tight control on risk, and my priorities are set accordingly. (For others, it might be to start with a $100 account, the loss of which they can easily shrug off, and use maximum available leverage in the hope of turning it into $100,000 as quickly as possible. For still others, it might be the guaranteed recovery offered by a martingale variant, because they are willing to wear the risk of sudden and unexpected loss of the entire account, at any future point. In short, forex is an open-ended vehicle that allows plenty of different speculative strokes for different folks).
The numbered points correlate with the numbers in my attached screenshot.
1. Statistical validity: This is the first thing that I look for. Given my long-term agenda, I like to see an absolute minimum of a 12 month, 500+ trade, track record, on a live account, and preferably a lot more. Anything significantly shorter than this is unlikely to be indicative of future performance, i.e. could be written off as “beginner’s (good or bad) luck”. Time is more important than number of trades, in that I believe it's important to demonstrate survival across as many different market conditions as possible. (However, offsetting this a little, I also understand that markets can 'evolve' over time [some possible reasons: economic, technological, trader belief/behavioral shifts], which means that distantly historical performance runs the risk of being unrepresentative of current market conditions).
Statistical longevity is important for two other reasons:
(i) many systems can be propped up for a long time by MM that is ultimately unsustainable, e.g. martingale variants; or otherwise rely on some kind of mean reversion, i.e. counting on open losses to recover, that will eventually be tested by 'black swan' or 'fat tail' moves; and
(ii) it is easier than many folk realise to be 'fooled by randomness', as is explained very well here.
Of course I realize that FF’s TE hasn’t yet been around for long enough to allow for track records of a decent size.
2. Profit factor: I once read an article in which a famous trader (it was Paul Tudor Jones, if I recall correctly) said that he could count on the fingers of one hand, the number of traders he knew personally that, over their entire career, had been able to maintain a PF>2. Hence, even allowing for the fact that retail traders have the advantage of agility, whenever I see a PF>2, I think something like “well either
(a) this guy is well on his way to becoming a multi-millionaire, or
(b) he’s employing some unsustainable MM, or
(c) if he doesn’t meet the criteria in point 1, then he’s been lucky so far”.
Any EA with a PF>2 almost certainly fits into category (b) or (c). If it seems too good to be true.......
IMO a better PF is obtained by dividing the profit pips by the loss pips. That cuts MM (point (b)) out of the equation. As I’ve posted many times before, MM can ultimately never rescue a trader/system whose entries/exits fail to attain positive expectancy. Trade expectancy determines whether your equity curve points upward or downward, and MM (position sizing) determines the steepness of its gradient. Increase position size and you increase return and risk in like proportion. In this post I illustrate how it’s possible to turn a 30% per annum return into 900%, by merely using MM and increasing trade & compounding frequency. If a trader/system has attained a pip-based PF>1.5 over more than 2 years, and 1,000+ trades, then that’s a symptom of a very proficient trader, IMO.
One very important point: PF must include open trades, i.e. unrealized P/L. A number of traders, instead of applying a formal loss exit strategy, leave trades open until they return to profit (or, even worse, average their losers). Unrealized gains and losses form a very real part of the available balance in a trading account.
3. Maximal drawdown: this is essentially the product of MM and risk management. If it has been allowed to reach > 30%, then the trader/system is sizing too aggressively for my personal liking. But, having said that, everybody’s appetite for risk is different. Remember that, if you’re using fixed fractional sizing (compounding your equity growth, by risking X% per trade), when your account is Y% in drawdown, it requires a gain of (100 x Y)/(100 – Y) percent to return to breakeven. For example, if your account is 20% in drawdown, it requires a (100x20)/(100–20) = a 25% gain on the remaining capital to return to BE. Hence the more you let drawdown run away from you, the more irretrievable it becomes.
In addition to this problem, risk of ruin increases geometrically when position size is increased. For example, if you double your trade risk from (say) 2% to 4%, your risk of ruin — however small it might be — is nonetheless more than doubled.
In general, risking the textbook 1%–2% per trade should keep you out of trouble; at least it will afford you some time to study your system performance, and if necessary, revise and overhaul your system, before drawdown gets completely out of control. However, if the trader/system has an exceptional win rate, then there may be reason to justify an increase beyond 2%. The table attached to this post gives the probability of attaining X consecutive losses over the course of 50 trades, for a given win rate. However, keep in mind that the table assumes 1:1 RR trades, and also does not take into account losing sequences that contain occasional wins, e.g. L– L– L– L– L– W– L– L– L– L has only 5 consecutive losses, but the losses exceed the wins by 8. Again, what constitutes acceptable or unacceptable drawdown is a personal decision, and it may be worthwhile to run some kind of Monte Carlo-type analysis (assuming that you have enough historical performance data) to gain some kind of feel for your optimal position size.
One final point: some traders don’t have all of their trading capital deposited with the broker, hence a X% drawdown in the account may be significantly less than a X% drawdown overall. (Obviously it’s only necessary to keep enough money in the account to avoid a margin call; the rest may be deployed safely elsewhere).
4. Lots per trade: I look at a breakdown of the individual trades, both for the use of stoplosses (alas, FF’s TE doesn’t show these), and unduly large variations in the lot sizes used. Large variations in size is a big red flag to me. Formal stoplosses aren’t essential, but if they’re not there, it’s impossible to determine what kind of loss exit strategy (if any) the trader is employing. If there are signs of averaging down, or (even worse) doubling down, then that’s the biggest red flag of all, IMO. Obvious signs of ‘hedges’, baskets and/or recovery/rescue trading are also a big turn-off for me, as they provide no real edge, and suggest that the trader lacks a basic understanding of trading math.
I work on a basic rule of thumb of 1 full lot per $25,000 in the account (scaled proportionally according to the account size). That equates to approximately 2% risk with a 50 pip stoploss. If position sizes are significantly larger than this, then I start to question the level of risk that's being taken. (See the XLS/image below: for example, at 2% risk and a 50 pip SL, you may trade 0.04 lots for every $1,000 in your account).
I also look at the largest losses in the account, percent-wise. Again, each loss should be no greater than 2% of the account balance, unless there are valid reasons for taking greater risk (e.g. an exceptionally high win rate).
5. Average win size divided by average loss size, preferably in pips. Most profitable traders/systems end up with a career RR>1, i.e. they win more on winning trades than they lose on losing trades. Hence a value > 1 is a healthy, but not necessarily essential.
I also compare the loss sizes (percent) with the win sizes (percent). A consistent highest %loss usually means that formal SLs are being used, which is good risk management IMO. And again, the loss sizes should, on average, be less than the win sizes, which is an indication of a healthy RR.
Finally, I check the winning trades (in pips) against the trade time. If there are many small wins (e.g. < 5 pips) for trades that have been open for several hours, this suggests that the trader might be playing some kind of recovery strategy, i.e. leaving trades in loss until they return to breakeven, a dangerous strategy that lacks 'cut losses' risk management. I'll open up the charts of such trades, to see how far they were allowed to proceed into drawdown; if the worst case is several times the size of the average winning trade (in pips), then that's another red flag.
For me, those are the “big five” criteria. The Sharpe and Sortino ratios give a measure of the consistency of monthly returns (higher values indicate greater consistency), but these are secondary, only after one has attained some evidence of positive expectancy.
Balances and percentages are much less important to me. These are the figures that attract newcomers to forex, but they can be easily skewed, not only by MM, but also by deposits and withdrawals from the account. With leverage and some luck, almost anything is possible — in the short term.
I’ll add to this post when I get some more time. But that’s enough for starters. I expect that it will provoke some interesting comment.
David
___________________________
UPDATE - Feb 5, 2018
A couple of points, in addition to the above:
#1. I prefer qualitative evidence to quantitative. In other words, I'd want to understand how a money manager's trading strategy works: what his 'edge' is, (especially) how he manages risk, and satisfy myself that he's fully conversant with the process of trading; in addition to seeing a performance history. There is always the possibility that TEs or myfxbooks can be faked or manipulated, or the results propped up by unsustainable MM (e.g. martingale variants; adding to losses) that will eventually fail, or some other ruse.
#2. I would NEVER allow a trader to manage my money unless:
He met the requirements of everything stated in point #1;
He provided evidence that he was both fully accredited, and regulated, by the relevant governing authorities in his country;
I knew the physical address of his operation;
I'd seen some kind of third-party verified performance history showing consistent results over several years' worth of changing markets;
The funds were held in a segregated account, in my name, and he merely had limited POA allowing him to trade on my behalf.
Attached Image(s) (click to enlarge)
Attached File(s)