|
Joined Nov 2009
|
Status: Don't Re- Member
|210 Posts
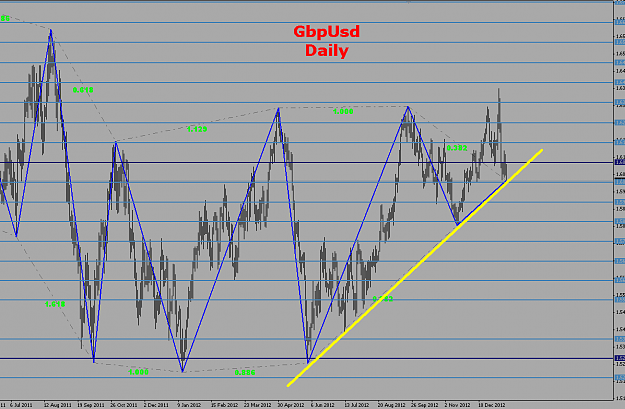
In the first picture, you see a zoomed out view of a Fib Based ZigZag indicator. I 'extracted' it from the ZUP indicator (which just by the way is a seriously good indicator if you are interested in following harmonics patterns). Those green numbers you read on the screen state the FibLine values from Hi to Low of each zig (or zag) to the next. The zigs are only formed if a FibNumber high or low is within reach or if a full on reversal or severe retrace takes place.
When you see a screen with EVERY zigzag showing green, you know that the pair is reversing SPOT ON the fib number marks.
Notice that right now where the price is, not only is it hitting 0.382 Fib Number, but it is also hitting the bottom of a possible channel. These pics do not habe FibArcs in them. I was busy with that when power cut. They show more.
selym_co, One thing that I think is going to happen here is that while she might go up or she might go down, I think this one is going to be a powerful explosion.
I will complete the redo the FibArc pics and post once done.
Joined Aug 2011
|
Status: All the world is a stage...
|857 Posts
Welcome BlueMental ;
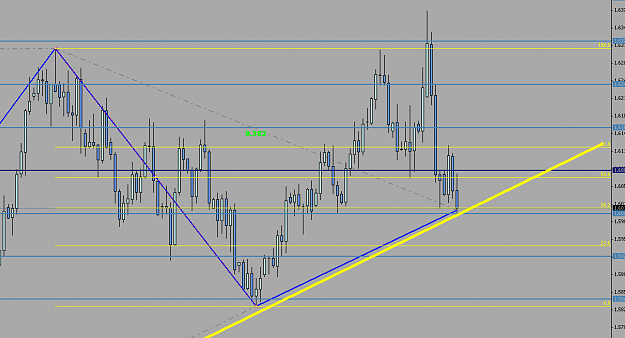
Its nice to see u back here. Those pics are really helpful , I am not against the indicators or tools apart from FiboArcs , every indicator has its own special talent. Tonite I was drawing and drawing on USDCHF , then I said what if I try simple tools like trendlines in the higher timeframe...then the picture is here :
Isnt it more and more and more clear about telling us whats happening there?
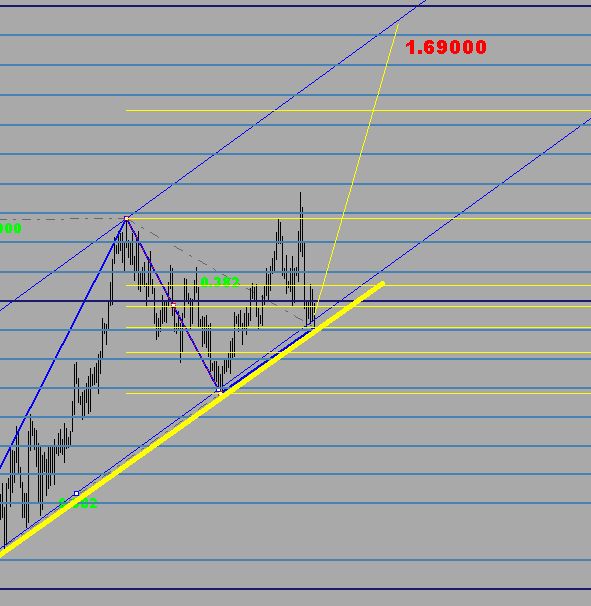
Yes , we mustn't stuck in one tool , and we shud study and study all the time in order to decode the patterns of this work of art (Forex market).After posting things here about GBPUSD which ı am still scared of , I also tried to see new circularr patterns in this pair with different erspectives. and I want to show you the picture which ı think is the true version :
The price is right on an energy point (the intersection of two FiboArcs and the trendline)(the magnet) and ready to bounce upwards...
by the wway its terrible when such things happen and you lose all that you have written down Thats why using a laptop is much better if you are a trader who has many different drawings on your charts etc ...
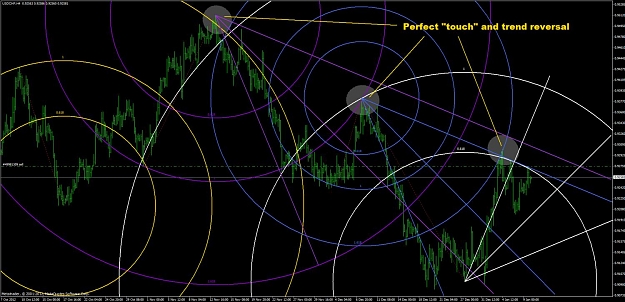
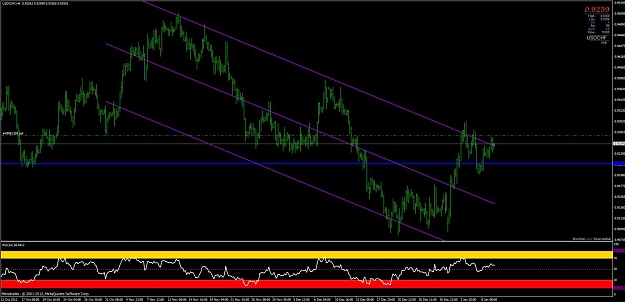
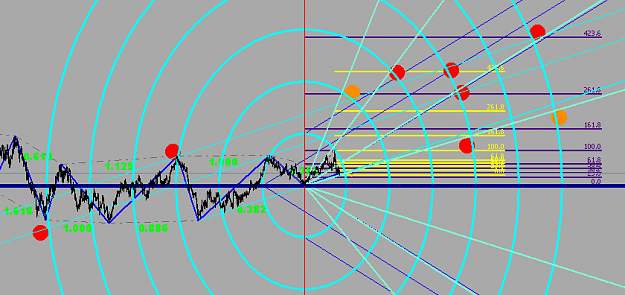
I wish to share my similar analysis on USDCHF, on a smaller tf (4H).
I also have a short view of price.
Please note (as shown in the pic), how price reacts (with a trend reversal) at the following levels:
- 1.618 (yellow circle)
- 1.0 (purple circle) and
- 1.618 (blue circle)
Of course, they are arcs drawn on previous key points
The strange thing is that not always we have such a precision (or "perfection" as selym says).
p.s. selym: is there a specific reason why you don't use forex-factory to upload your pictures?
This is another view of USDCHF (4H) which would confirm a short trend: a simple volatility channel (std deviation).
Price bounces on the extreme borders of the channel.
If analysis is correct, due to strong inverse correlation with EURUSD, this will go long
I wish to share my similar analysis on USDCHF, on a smaller tf (4H).
I also have a short view of price.
Please note (as shown in the pic), how price reacts (with a trend reversal) at the following levels:
- 1.618 (yellow circle)
- 1.0 (purple circle) and
- 1.618 (blue circle)
Of course, they are arcs drawn on previous key points
The strange thing is that not always we have such a precision (or "perfection" as selym says).
p.s. selym: is there a specific reason why you don't use forex-factory to upload your pictures?
Ignored
Some of the origins of your lines seem to be invisible. I noticed you could be using GANN, but I feel like you're using random points for half of the stuff.
I wish to share my similar analysis on USDCHF, on a smaller tf (4H).
I also have a short view of price.
Please note (as shown in the pic), how price reacts (with a trend reversal) at the following levels:
- 1.618 (yellow circle)
- 1.0 (purple circle) and
- 1.618 (blue circle)
Of course, they are arcs drawn on previous key points
The strange thing is that not always we have such a precision (or "perfection" as selym says).
p.s. selym: is there a specific reason why you don't use forex-factory to upload your pictures?
Ignored
You are right , its not perfect all the time , but its the strongest instict of everything to be perfect / to obey the golden ratio . Today was ana amazing day , I made ultra amazing pips in EURTRY in my serious account I dont know what the made-up reason for this strong movement (today) but its a strong clue that circular waves are on progress
P.S. There is no special reason that I use imageshack for the pictures , but it looks cool like that , doesnt it? Then I can use the prompt and the picture stands in the middle of the page...
Aaaaahhh .... Today was amazing ! Regards to everyone ...
There is no special reason that I use imageshack for the pictures , but it looks cool like that , doesnt it? Then I can use the prompt and the picture stands in the middle of the page...
Aaaaahhh .... Today was amazing ! Regards to everyone ...
Ignored
Hi. I also used to use ImageShack, but I found that the small png file I upload gets converted to a large file.
My pics are on average 20 to 25 KB's. The ones via URL through Image Shack are 150 KB. Here where I live, data bundles are expensive, so I found that a direct upload (though it gets stacked and placed at the bottom of the post) uses 25KB, and every bit helps.
As far as the 'why' Eur bounced up... Just look at those pics I posted. There are lmagnets happening there big enough to move planets. It is super cool to enter a Long trade from the bottom of an uptrend channel right off the bounce.
I missed it for two reasons. One (as is my usual woe is me state, I am in a SEVERELY losing short trade on GbpJpy (-285 pips as we 'speak') and Two, because I wasn't watching the charts today.
I already thought I was too far in the red to hedge with Eur. You know Murphy's law, the second you hedge, the trend reverses and explodes the other way. Leaving you exactly where you were plus extra spread and pips of the hedging position.
I (therefore) hope my pics below are wrong, in that I would prefer EurUsd to break below the channel and head South... The problem is, I don't think I'm wrong.
Oh well such is life. I'm glad you made good pips.
Hi. I also used to use ImageShack, but I found that the small png file I upload gets converted to a large file.....It is super cool to enter a Long trade from the bottom of an uptrend channel right off the bounce.... I am in a SEVERELY losing short trade on GbpJpy (-285 pips as we 'speak') and Two, because I wasn't watching the charts today.....I (therefore) hope my pics below are wrong, in that I would prefer EurUsd to break below the channel and head South... The problem is, I don't think I'm wrong.....I'm glad you made good pips.
Ignored
First of all imageshack really looks cool And while saving my pictures I save them as gif files which are reallly small in size when compared to png and jpf file formats. And ı do not have limitations about the internet connection , so its not a big problem...But if forexfactory had cntering option for the pictures , then I wud use it...
It is yes super cool to enter a trade from the bottom , But EURUSD didnt activate my pending BUY orders , instead EURTRY which smiled on my face and all of my pending orders were activated (0,04-0,03-0,02-0,01) . I realized the profits in the evening when I came home. What I like the most about MT4 is that it allows you to locate pending orders whereever you want. I feel as if ı am a hunter in this wild forex jungle , and ı just put my ending orders in the bushes which have strategic locations on the path that will be followed by the price AUDUSD , GBPUSD , EURJPY were the other profiting pairs... I was expecting to get around +200 from each of them...but I just closed them , I already have good profits ...
I am sorry for your situation , but do not you use a SL ? Isnt "-285" too much? I hope somehow it turns into positive... For sure you must have a strong heart...I am also not live trading...its the demo account , I started a commercial trading account nowadays , I share my signals with some people , so I created this serious 2500USD account And as being the f,irst week , its an amazing week...I hope the same for everyone !
About EURUSD , I still think that its trying to be perfect , and it just broke the minor circular wave structure which opens the door of the perfection of 1.618....here is the picture...
Gif's are slightly smaller than Png, but depending on the detail in the picture, the quality conversion sometime gets 'blotchy'. Not as bad as Jpegs, but not as good as Png. But that is no big deal. Jpeg is the one that is messy. It is all a matter of personal choice.
I choose to waste as little resources whenever and wherever possible, be they extra bandwidth use adding to the load,which leads to either monthly payments for 'elite sections' like TSD, or mor Banner Ads jumping in my face on every page. Like FaceBook with the standard 6 adverts of 'click here to meet 200 single girls', or be they one less plastic bag when shopping. That is my method of doing my bit to cut down one less tree in the Amazon and one less poisonous waste dump shipped to a third world at 'cheap' global rates.
Quote
Disliked
...I feel as if ı am a hunter in this wild forex jungle , and ı just put my ending orders in the bushes which have strategic locations on the path that will be followed by the price ...I already have good profits ...
I agree with you fully. Who cares if you did not get ALL of everything. You made profit. That is after all our aim in trading.
Quote
Disliked
I am sorry for your situation , but do not you use a SL ? Isnt "-285" too much? I hope somehow it turns into positive... For sure you must have a strong heart...I am also not live trading...its the demo account , I started a commercial trading account nowadays , I share my signals with some people , so I created this serious 2500USD account And as being the f,irst week , its an amazing week...I hope the same for everyone !
Do not be sorry for me my friend. I made my bed, I lie in it. It is my stubborn stupidity. I must deal with it. Strong heart or just plain stupid?
As your picture (and mine earlier) show, EurUsd IS being perfect and IS following the pattern 100%. She has chosen that the deli(South Side of Town) is not as important as the Ice-cream parlour (north side) is. I am trying to win an already lost argument with her.
If by some miracle, I do not trash this account within the next week, and it is 'recoverable or perhaps even slightly profitable after a long stretch in the red, will I have learned the lesson?
Intellectually yes. But something in the way I am wired leads me to consistently ignore the intellectual understanding and NOT place SL. I hope (for obvious reasons) that I break this 'wiring' out of my system. Only time tells.
Joined Aug 2011
|
Status: All the world is a stage...
|857 Posts
EURUSD ... I wanna share this with you guys ...
First of all I shud say that there is the circular resistence around 1,3429s where I placed my pending SELL orders , I think there is no need to share a picture about it. On the other side I just tried to use Fibonacci Levels and detect the potential reversal zone. The intersection of many tools almost around the same bearish zone will be a good setup. Anyway , here is the picture showing that the price almost reached the circular resistence :
If we place a Fibonacci Tool starting from 1,20s and ending at 1,3150s then we can easily see that the 1,27 line passes through 1,3480s which is an important resistence at the same time if you scroll the chart to the left. The intersection of these two levels give a great potential of bearish reversal. Another interesting thing is that 1,3480s line is the %50 of the big cycle at the same time...so we have the intersection of three different Fibo level pointing out almost the same exact level for a potential reversal zone.
And the final "coincidence" is the [AB]=[CD] pattern which points out the same level. When we measure the last daily swing with the Fibo Expansion tool we get a zone between 1,3428-1,3593 for a possible reversal zone , through which many important reversal levels pass.
Joined Aug 2011
|
Status: All the world is a stage...
|857 Posts
XAUUSD ... Gold is still being dominated by the 100 Scale FiboArcs and the 45 degree line which helps us to have a general idea about the direction of the trend. Feeling "regret" that I closed all of the LONG trades before the traget is reached , I also placed my pending SELL orders at the intersection zone of the circles and the 45 degree line. As you can remember from the old posts , there is another circular suport (pink circle which does not exist in this picture) which the price shud touch in order to start a strong bullish trend.So price needs some time ... We can say that the big bullish trend (if it will happen) will not start as the continuence of todays trend...we will again visit 1650s after touching 1700s ... thats the forecast , its never certain
The real thing which I want to tell about is the green circular structure which begins from the top of the price (0,9975) , and that structure is also drawn the 45 - 22,5 - 67,5 degree lines . 45 degree line , being the center of our focus has acted well. But now the price is above 45 degree line and this situation gives us an impression of the possibility of a bullish pressure until the price touches 67,5 degree line. Here comes the "but" sentence .... But if this pair moves up to the 67,5 degree line then it will result...
Ignored
The trend in USDCHF did not surprise me at all , but honestly this movement was not something that I wanted It just warns me about the validity of my possibility scenarios...But at the same time the price has been stopped by the circular resistence , a bearish trend shud be expected in a few days time (which will appear as a bullish trend in EURUSD) .. We shudnt forget that its just a possibility ... I do not have positions in this pair , but it helps to forecast abour EUR pairs. The 45 degree line really acted well , I didnt know that it was so effective... http://img189.imageshack.us/img189/3176/usdchfh.gif I am at the hospital with my bro , he will have a small operation tomorrow and ı am staying here with him , thats why ı cannot tell much...Greetings to everyone...
Joined Aug 2011
|
Status: All the world is a stage...
|857 Posts
EURUSD ... The pair is still above the 45 degree line (black trendline in the picture) which tells us that the price is still eager to go upwards which confirms our bullish possibility scenarios. The bullish pressure will remain still as long as the price stays above the 45 degree line. On the other hand we have some harmonic analysis made with the Fibonacci ratios which give us a reversal area around 3450-3500 ; and also it is a strong resistence zone at the same time. So we can say that the price needs another bullish attack to conquer that level ...
When we look at USDCHF (which is negatively correlated to this pair) we again get a picture of the price stopped by the circular resistence. But honestly it stays above 45 degree line and gives us an impression of a bullish intention in USDCHF ...
It seems to be a complex situation , but we play the biggest possibilities during this game. As I said before all the world is a stage and we play our parts when the right time comes... So I thing looking for chances to BUY EURUSD will be the best thing we do nowadays... Time will show ....
Joined Aug 2011
|
Status: All the world is a stage...
|857 Posts
EURUSD ... When we look at the weekly and daily candles it becomes easier for us to forecast how the pair will behave in the following days. The previous weekly close confirmed a bullish weekly signal , which had a %50 retracement until today , the fourth day of the week. And when we look at the daily chart we can see a daily bullish candle formation (which is not completed yet). If the candle closes around these levels the end of the retracement will be established , and a new bullish wave will start ...
Joined Aug 2011
|
Status: All the world is a stage...
|857 Posts
Hi guys ;
I am still at the hospital with my bro , I hope he will be OK soon and we will go home. I was just drawing and drawing new things on the charts when he was sleeping. And I want to share the weekly chart and the circles on it with you , and I want you all to witness the strict dominance of the angles : 22,5 - 45 - 67,5 ...As GANN noted down the 45 degree line can be the balance angle which devides the 90 degree-angle spectrum into two parts called bullish and bearish. If the price is above the 45 degree line then there is a strong bullish pressure ; and if the price is below the 45 degree line then we can say that there is a strong dominance of the bears.
When we consider the weekly chart and draw such angles on the screen then we get a good result which supports our sentences above. The 45 degree line really acted well in the pair , and now the price is targeting the -22,5 degree line . the intersections of the circles and the -22,5 line are the potential targets of the price...
If you are making preperations to make some pips from EURUSD , you shud be watching this formation...it will be a kind of confirmation that the bullish trend will start soon...
I am still at the hospital with my bro , I hope he will be OK soon and we will go home. I was just drawing and drawing new things on the charts when he was sleeping. And I want to share the weekly chart and the circles on it with you , and I want you all to witness the strict dominance of the angles : 22,5 - 45 - 67,5 ...As GANN noted down the 45 degree line can be the balance angle which devides the 90 degree-angle spectrum into two parts called bullish and bearish. If the price is above the 45 degree line then there is a strong...
Ignored
EURUSD ... Finally the pair has answered our demands and has started its bullish trend today. There were many reasons which support the bullish scenarios including USDCHF chart and the candle formations in that pair. The BUY orders havent reached the target yet , but at least gave us a chance to adjust SL to +1 and stay out of the risk..so we are just %50 successful up to now. the bullish in this pair does not seem to have the potential to slow down.
The simplest reason for the bullish pressure was the support zone which the daily candles settled on during the last 7-8 days including some daily enfulging bullish patterns. And if we look at the recent chart , if the day ends up at these levels then it will be a big set up for the bullish daily trend targeting 1,3790s ...
When we look at the daily chart with the [AB]=[CD] perspective then we again get a result of 1,3790 which has to be reached... On the other side we shud be aware of the major level traders who eneterd the LONG orders around 1,30 targeting 1,40s ...
And lets come to our topic : the circles ...
The price has broken the daily circle which tried to keep the rice inside as long as it cud..In other words the price was captured and squeezed between the circle and the 45 degree line and today the explosive bullish enfulging pattern gave us solid signals for the existence of bullish attacks....I will close my orders in case they reach something like +200 .. and then will seek for another chance to enter a new trade ...
And the second pictrure is the enfulging bullish pattern settled on the support zone (not completed yet) ...
Joined Aug 2011
|
Status: All the world is a stage...
|857 Posts
The week is finished for me , and I quited every trade before I reached the target 1,3470s-1,3500s . Well at least there is no feeling of regret , because I am here to make money , and I have reached my purpose.
Being one of my most favorite pairs , EURUSD has been soo boring for the last 7-8 days , but at the same time there was the 1,3428 target in harmonic understanding which made me realize my profit when we reached 1,3430s. There is no further need to make new analysis for this week ...so have a nice weekend ...
And I was really happy to see my name in the 20th position (weekly demo accounts) ...