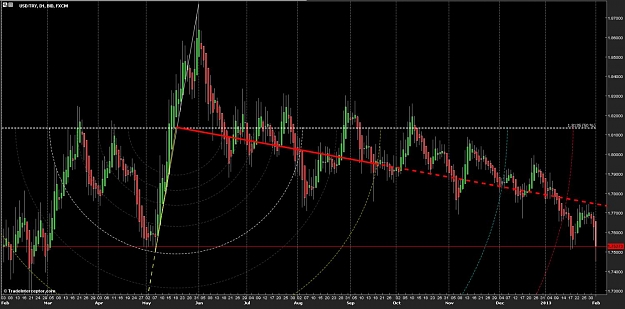
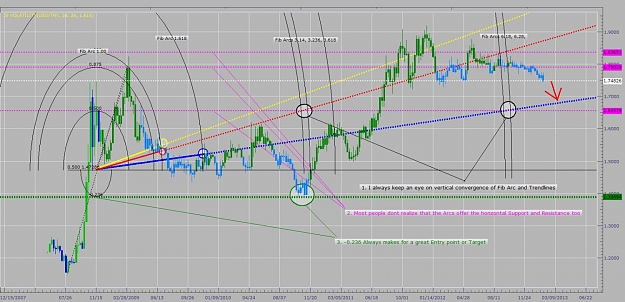
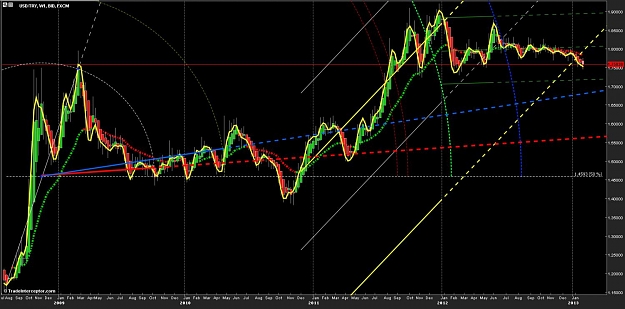
EURUSD ... The previous week has been a really important week for the destiny of the pair , in other words that week had a conclusive role in the market. I know , the screenshot really seems to be complex , but every drawn tool in that picture is for some purpose , and I really tried my best to simplify the screen by deleting the less important tools. First of all , like it says in the topic we will be focusing on the circular waves in the market. EURUSD consolidated just below the circular resistence for the last 7-8 days telling us that it was just about to decide whether to go up or down. And by breaking out the circular resistence it has shown us that the following weeks will be under the pressure of strong bulls which will carry the price to really higher levels. As a conclusion we will be looking forward chances to BUY this air in the following weeks until we reach the targets.
Like we said in the previous posts this is just the pattern of the nature and somehow the fundamentals also suit the natural flow of the price. So we can say that the price is the master and the fundamentals are just the explanations of the trends , maybe they are also the incidents of the same destiny This circular structure really amazes me!!!
On the other hand we have the 45 / -45 degree lines which act as maps for the price , and when we put them on the chart then we get interesting results. I just hold them from the middle and drag them around the screen to ANY support or resistence , then I notice that those lines are the potential reversal points for the pair. Anyway , you can see the lines on the same picture with the cloned trendlines...
Contrary to wat circular trend-waves tell , horizantal fibonacci levels come forward this week , because the %50 Fibo resistence is really important and I am %100 sure there are lots of sellers at that level targeting 1,20s again. So it will be so natural for us to see a consolidating market in the following days ... and yes they will be boring too ...
As a summary :
1- The price has broken an important circular resistence and formed a bullish enfulging candle formation in the weekly timeframe.
2- The 45 degree lines tell us that the price has much to go !!!
3- What we claim here is that fundamentals follow the price ... and both price and fundamentals and the price are the slaves of a strong authority. And that authority is an amazing artist which gives great importance to geometric harmony and symmetry !!!
4- The circular resistence which the price just broke is the 1,618 level of an inner wave , so it was really important !!
5- There are lots of sellers waiting at the %50 Fibo level which will not let the price creep up to higher levels easily. So we will be face to face with strong consolidation in the following days.
6- We will be looking for chances to BUY this pair in the following days
Regards ...
http://img210.imageshack.us/img210/9687/circles.gif
Like we said in the previous posts this is just the pattern of the nature and somehow the fundamentals also suit the natural flow of the price. So we can say that the price is the master and the fundamentals are just the explanations of the trends , maybe they are also the incidents of the same destiny
On the other hand we have the 45 / -45 degree lines which act as maps for the price , and when we put them on the chart then we get interesting results. I just hold them from the middle and drag them around the screen to ANY support or resistence , then I notice that those lines are the potential reversal points for the pair. Anyway , you can see the lines on the same picture with the cloned trendlines...
Contrary to wat circular trend-waves tell , horizantal fibonacci levels come forward this week , because the %50 Fibo resistence is really important and I am %100 sure there are lots of sellers at that level targeting 1,20s again. So it will be so natural for us to see a consolidating market in the following days ... and yes they will be boring too ...
As a summary :
1- The price has broken an important circular resistence and formed a bullish enfulging candle formation in the weekly timeframe.
2- The 45 degree lines tell us that the price has much to go !!!
3- What we claim here is that fundamentals follow the price ... and both price and fundamentals and the price are the slaves of a strong authority. And that authority is an amazing artist which gives great importance to geometric harmony and symmetry !!!
4- The circular resistence which the price just broke is the 1,618 level of an inner wave , so it was really important !!
5- There are lots of sellers waiting at the %50 Fibo level which will not let the price creep up to higher levels easily. So we will be face to face with strong consolidation in the following days.
6- We will be looking for chances to BUY this pair in the following days
Regards ...
Imagination rules the world ...