Is there any chance someone brilliant has or can create an indicator sub window where historical bank rates for the major currencies could be displayed similar to a flowmeter style indicator with color coded lines?
The attached indicator (which I wrote a few years ago) will plot ANY data stream in a MT4 chart sub-window. The data to be plotted must already exist in a CSV file in the .../MQL4/Files folder, sorted into ascending date order (i.e. earliest data at the start of the file), and the format of each row (line) in the file must be:
<date/time>,<value>
where <value> is the value to be plotted underneath the candle representing <date/time>
Example:
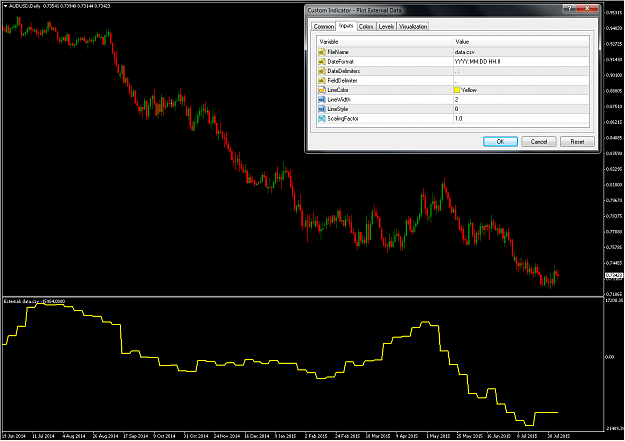
The screenshot below illustrates how the indicator was set up to plot weekly COT data. (The plot appears 'stepped' because the data values change weekly, i.e. only once per 5 candles on the displayed daily chart). The content of the data file data.csv is as follows:
If you build suitable data file(s) for your particular requirement, then I will show you how to set up the indicator parameters needed to plot the data.
NOTE: you can have multiple plots on the same chart by attaching the indicator multiple times, with each plot using a different data file. The plots may be either (1) in the same sub-window, by dragging the indicator into that sub-window when attaching it; or (2) in separate sub-windows, by dragging multiple instances of the indicator onto the main chart. Or combinations of both, however you wish.
__________________________________
[EDIT] I have updated the indicator and posted a new screenshot. It is now possible to set the color/width/style of the plotted line, and also scale the plotted values using the ScalingFactor.
The parameters work as follows:
FileName — the name of the file that contains the data to be plotted. See my notes above for the required format. As already explained, the file must already exist in the .../MQL4/Files folder, and be sorted into ascending date order.
DateFormat DateDelimiters — these work as follows:
If the DateDelimiters parameter is blank, then the items in the DateFormat parameter represent the exact positions of the year (YYYY or YY), month (MMM if "Jan","Feb", etc; or MM if a 2 digit number), day (DD), hour (HH), minute (II) and second (SS) in the date string. Also, an 'A' anywhere in DateFormat means that the dates are in 12 hour time (e.g. 10:36 pm). All other characters in DateFormat are merely padding, to get DD, MM, etc into the correct positions matching the <date/time> in the CSV file. For example, if you set DateFormat to MM DD YYYY, then the indicator expects the month to be stored in character positions 1-2, the day in character positions 4-5, the year in character positions 7-10, and there are no hours, minutes, or seconds values.
If the DateDelimiters is not blank, then each character entered will be treated by the indicator as a delimiter that separates one field (e.g. the month from the year) from another. In other words, the delimiters determine the order and location of the fields, rather than absolute character positions. Hence if the data has a variable number of characters, e.g. some dates are like 1/5/2015 while others are like 10/27/2015, then by including '/' in DateDelimiters, and specifying MM/DD/YYYY as the DateFormat, this is telling the indicator to look for the month number, followed by a slash, followed by the day, followed by another slash, followed by the year, and that the number of digits in the month, day and year are irrelevant. You can specify multiple delimiters, e.g. slash (/), colon (: ) and space, to allow for date components to be separated by slashes, time components by colons, and a space between the date and the time.
FieldDelimiter — the character used to separate the <date/time> from the <value>. It defaults to a comma.
LineColor LineWidth LineStyle — These set the color, width and style of the plotted line.
ScalingFactor — all plotted values are multiplied by the number you enter (hence a number > 1 will make the values larger, and < 1 will make them smaller). This may be useful if you are plotting multiple, disparate data sets in the same sub-window.
{quote} 'Plot External Data' indicator The attached indicator (which I wrote a few years ago) will plot ANY data stream in a MT4 chart sub-window. The data to be plotted must already exist in a CSV file in the .../MQL4/Files folder, sorted into ascending date order (i.e. earliest data at the start of the file), and the format of each row (line) in the file must be: <date/time>,<value> where <value> is the value to be plotted underneath the candle representing <date/time> Example: The screenshot below illustrates how the indicator was set up to plot...
No point in re-inventing the wheel. Simply drag MT4's native MA indicator from the Navigator into the sub-window, and set 'Apply to' = 'First Indicator's data'.
______________________________
Is there any chance someone brilliant has or can create an indicator sub window where historical bank rates for the major currencies could be displayed similar to a flowmeter style indicator with color coded lines? Thanks
Ignored
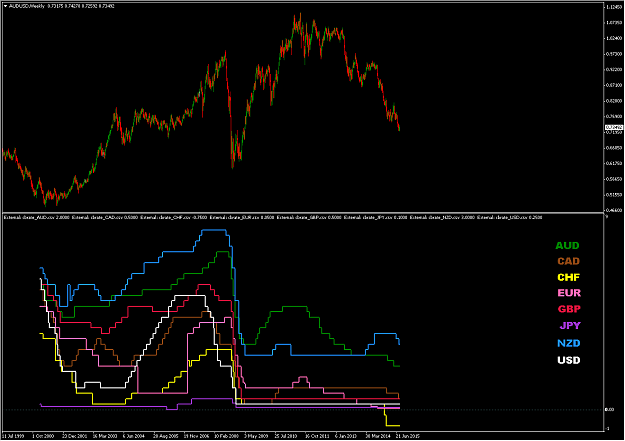
I got VERY lucky: stumbled upon this webpage, which allowed me to create a quick'n'dirty historical bank rate downloader -- 'CB_rates Downloader.exe' in the attached zip. This app created the .csv files in the zip. (Note: if the webpage format ever changes, the app will no longer work correctly, and you'll need to update the .csv files manually).
To install, just download everything into the same folders as in the attached zip file, and you should be good to go. The template should produce something like the attached screenshot. Beyond that, feel welcome to experiment for yourself; I've spent as much time as I want to on this job now.
Hanover, do you think we might be able to do something similar for treasury bond yields? I know I ask allot, but you're awesome, so maybe you might entertain?
Hanover, do you think we might be able to do something similar for treasury bond yields? I know I ask allot, but you're awesome, so maybe you might entertain?
Ignored
The Plot External Data indy will plot any data that you wish. Hence the issue is not programming a MT4 indicator --- nor is it a case of whether 'hanover' is awesome or not (LOL) --- the problem is finding the required data somewhere on the internet in an easily downloadable format (and it must also be free, unless you're willing to pay for it). Like I said before, I was lucky to find the CB rates.
Anyway, I have other projects to work on, for the moment.
_____________________
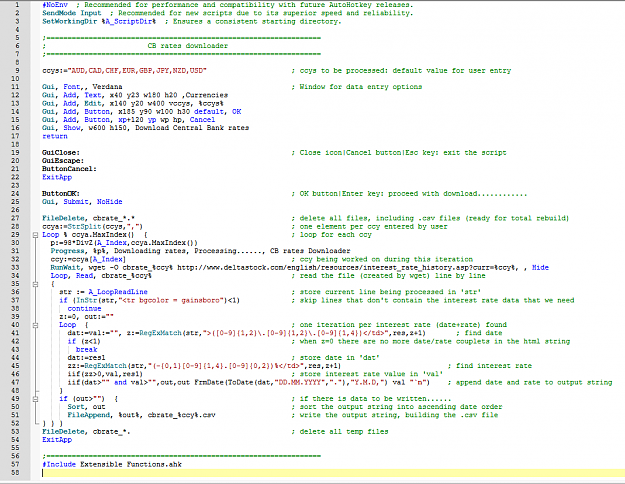
Just in case any programmers are interested, the screenshot shows all of the Autohotkey code needed to extract the bank rates from the website ('CB_rates Downloader.exe').
I'm really enjoying coding in Autohotkey, it's the most 'efficient' and 'forgiving' language I've ever used. Very easy to learn, took me less than a week to become fluent enough to rewrite my FF calendar news downloader. AHK is much, much more than a tool for creating macros and remapping your keyboard --- although all that is possible too. Scite4autohotkey IDE can be found here.
Hanover,
Thank you for all of your hard work. The CB indicator is great! I used it to go back and see reactions which was enlightening. After thinking about it, I realized that having the graph and my screen doesn't help for future trading other than it shows me the rates, which seldom change. Which brings me to another deduction of what might be helping for future trading.
It is my belief that the bigger the central bank rate differential, the more "longterm flow" potential from the low rate to the high rate for carry trades etc. Of course this information could have very short term use as well.
Take AUDUSD for example. It had been oversold for some time and last week we see a great retail sales data followed by RBA rates that had not changed, but because of the bullish retail data and the differential between USD and AUD we see a huge bullish AUD reaction, which tells me people are definitely concerned with the CB rate differential.
Could you potentially create an indicator that could post a label on the main screen that will post the differential itself. For example on AUDUSD it would post as +1.75% and on GBPNZD we would see -2.50%. Then we could also shade the negatives red and the positives green so at a quick glance the trader can see whether we have a bullish or bearing differential. As far as the data goes we could get it off of the same website and somehow integrate it automatically or manual download?
Take AUDUSD for example. It had been oversold for some time and last week we see a great retail sales data followed by RBA rates that had not changed, but because of the bullish retail data and the differential between USD and AUD we see a huge bullish AUD reaction, which tells me people are definitely concerned with the CB rate differential.
Ignored
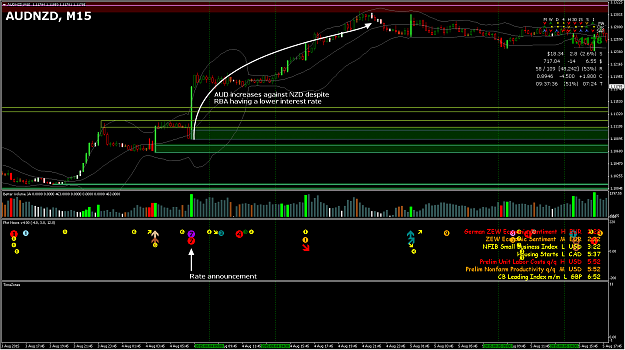
Hmm, I respectfully disagree that the bullish reaction was due to the rate differential. As a counter to your logic: when the unchanged AUD rate was announced, the AUD strengthened across the board, even against the NZD, whose CB has a HIGHER rate than the AUD's. See attached screenshot. The general consensus for the reason behind the AUD's increased strength was that Gov Stevens' comments were less dovish than expected, as opposed to the actual rate itself.
IMHO it's not the rate differential between nations that moves prices following an announcement, but the extent by which the actual outcome of a news event deviates from the anticipated outcome; or the extent to which the actual outcome has already been anticipated, and its effect has therefore already been 'priced in'.
For example, if the market has been anticipating a 25 bps rate cut prior to an interest rate announcement, then -- everything else being equal -- I would expect its effect to be priced in by the time of the announcement. If the CB surprises the market by not cutting, I would expect an immediate across-the-board bullish reaction for the currency; if there is a 50 bps cut, a bearish reaction. None of which has anything to do with the rate differential between that currency and another currency.
Hence I don't think an indicator showing rate differentials would be that useful. And in any case, as you point out -- rate changes are infrequent -- and (if you are an advocate of the carry trade) it's not too difficult to maintain a mental note of which of the eight major CB's rates are high, and which are low. You could easily maintain color-coded rate differentials in a spreadsheet, if you want to have the differentials calculated automatically. No point in wasting time programming when there is a simpler solution.
Touche, well then. I over analyzed the whole thing. End of another chapter in my journey of research. : )
Ignored
It's all just my humble opinion, of course. I could easily be wrong. Also, it's dangerous for me (or anybody) to say things like "the market expects...." when, in reality, the market consists of a zillion anonymous participants whose agendas are completely unknown. I merely follow news feeds and commentators whom I believe are reliable more than 50% of the time. And it goes without saying that they are fallible, also.
Well your opinion means a lot to me because I know you have a wealth of knowledge. In any event, I'm crossing this off my list of things to keep track of as well. I know you got a lot of people who bug you on a daily basis for your expertise, but I would be obliged if you visited my new thread:
Even if you decline, I'd still like to have your review. My system is nearly assembled. I just need this one last piece to assimilate my strategy before I start throwing some weight around in the market.
FWIW, I agree with your idea of normalizing values by multiplying them by $/pip. I included equivalent options in PSA (RescaleUsingATR, UseDollarValuerNotPips settings), and also in my own MM when placing trades (I attempt to explain 'ADR$' here).
People may disagree with me, but IMHO there is no right or wrong -- or even superior or inferior -- way to trade. It's arguably an overused cliche, but ultimately everybody must find their own 'edge', one that suits their personality and lifestyle, and inevitably evolves with their journey as their knowledge continues to grow. I have found -- or perhaps should say, am continuing to find -- my own way, and nowadays (for better or worse) it is based on a mix of FA and TA.
If implementing your 'edge' requires some programming, then I would suggest that you consider learning how to code yourself. Programming involves time and effort, and nobody will code your methodology with as much finesse and enthusiasm as you. Perhaps I'm selfish, but I've grown tired of coding others' ideas and strategies, because -- if I may speak candidly -- to whatever extent they are incompatible with my own, the whole process is unhelpful to me. And I've concluded that if I'm not enthusiastic about a certain strategy, then I'll never be able to trade it profitably myself.
Failing that, you might try posting in one of the dashboard threads that have popped up over the last few months. If can convince one of the coders that normalizing via $/pip is helpful, then you'll possibly get your requirement coded for free. Or if you're willing to pay, you could look to something like elance or the MQL4 site (or let me know, and I can recommend at least 2 very good programmers).
Good luck,
David
PS: if you're still using the Plot News indicator, you might be interested in this.
{quote} The general consensus for the reason behind the AUD's increased strength was that Gov Stevens' comments were less dovish than expected, as opposed to the actual rate itself.
Ignored
Most economic numbers are measurable, but how does one measure whether a speech is dovish or hawish?
is there any index/guideline or educational source to decipher market moving speeches for trading purpose?
Most economic numbers are measurable, but how does one measure whether a speech is dovish or hawish?
Ignored
IMHO: firstly, interpreting speeches is an art rather than a precise science. Secondly, it's often a case of looking for changes in the central bank rhetoric, especially changes that the market is looking for (see example #2 below).
Some definitions:
"Hawkish" = tendency toward a tightening of monetary policy, usually by an indication that the CB is preparing to hike (increase) interest rates
"Dovish" = tendency toward an easing of monetary policy, usually by an indication that the CB is preparing to cut (decrease) interest rates
I will try to illustrate with a couple of simple examples:
#1. A Reserve Bank governor has been talking about the possibility of further rate cuts in his last few speeches. Then suddenly he says something along the lines of "low inflation is no longer seen as an immediate problem, and any further easing will be dependent on future inflation data". That is significantly less dovish than previously, and (everything else being equal) will almost certainly result in an immediate appreciation (i.e. instant spike) in the value of the currency (relative to other currencies). That's a fairly extreme example, often any changes in rhetoric are more subtle than that.
#2. A good example was the "considerable time" phrase a few months' back, where commentators and institutional traders became fixated on whether these words would be retained in the FOMC's announcement. The context was whether they would keep rates on hold for a "considerable time", or not. If the phrase was dropped, indicating that rate hikes could reasonably be anticipated earlier than previously expected, then that was hawkish, and hence bullish for USD.
#3. A couple of other examples that provide some context: here and here. Jakeparkin's whole thread also gives some good insight into the way that many institutional traders think IMHO. Search for the words "hawkish" and "dovish" in that thread.
It takes experience to get a feel for what numbers (inflation, employment, production, growth, etc) the CB's are focused on, and how their rhetoric reflects that. It can also be important to know what the market is anticipating, and also how long a CB view has around, i.e. if it has been around for a while, then its effect will likely already be priced in, and it will take fresh hawkish/dovish comments or data numbers (i.e. increase in inflation/employment/production/growth/etc can lead to tightening policy; decrease can lead to easing) to continue to provide fuel for the current move.
Remember that a trader's goal is to get (useful) information earlier than everybody else, so that he can get the 'best' price and act upon it before the herd, i.e. catch any move in its early stages. But EVERY fundamental trader is trying to win that same race, hence the effects of news can, in some cases, become priced in very quickly. (Of course this is what causes instant spikes when news is announced: e.g. a zillion traders all trying to buy a currency, and there are insufficient sell orders at the immediately higher levels to absorb the buying, hence price leaps instantly to levels where high volumes of sell orders are congregated -- think "supply/demand").
To help me establish what the market is focused on, I'm subscribed to a mentor/service (can't mention his name outside the commercial forum, but it's pretty obvious LOL). He gets some of his info from sites like forexlive, centralbanksinfo, bloomberg and efxnews, to name a few. Built into the subscription is a link to the RANsquawk news feed, giving immediate audio and text-based access to significant news announcements in most markets. They also poll top analysts as to what the probabilities of rate rises/cuts etc are and publish results. Having all of this info in one place saves me a lot of legwork. No doubt there are other providers who are equally good, but I've grown accustomed to those.
It's too hard to explain everything that I've learned in a couple of short paragraphs, but I hope that this has helped give you a basic idea.
David,
Can you email me about this subscription service? I'm not sure how to PM on here. I agree with everything you just said and I believe what you are saying about this game. My email is [email protected]
If anyone gets this reply and can help, I try downloading @hanover provided and even put a new data file so it would appear in the apportate x axis on mt4, but nothing appears.