Hi, Yaed !
If I can figure a reasonable answer for you, I'll give it a try.
--------------------------------------------------------------------------------
Separate from and ignorant of the post above,
I wrote another new (practice) trading method.
This time,
most of it is written on the pictures of charts below:
A line segment is vertical, and its severe with-the-money attribute is the first thing I draw.
Then, any all-radiuses i.e. circles/curves,
Areas two-fer -- thus, the name of the method -- opposites,
so that area can be both ruled out and squares to at least surround that area and, third, projecting patterns may or may not align with such a big number of candles.
Then, triangles may be drawn off opposite-situating points, and so on, for the details to consider.
-- The method is simple, but it's well-organized -- I assume, and I've only practiced it in the pictures above -- and thus effective (I think, as of now).
-----------------------------------
last method:
"
In this method, I simplify the technicals -- although the option to complicate them is, still open.
I use a grid -- vertical and horizontal lines, where applicable -- , an anti-grid -- any 45D - or - so (50D, too, I'd guess) -- (a great place for long-term - lines ('complicat'ions)), and a grid-maker -- curves, as represented in MT4 by circles (or, rather, ellipses).
Then, the 50D illusion, which may or may not decide direction, stays:
The 'A rule from here ( https://www.google.com/search?q=Three+elemental+illusions+ determine+the+Z%C3%B6llner+illusion &oq=Three+elemental+illusions+deter mine+the+Z%C3%B6llner+illusion&aqs= chrome..69i57.352523430j0j0&sourcei d=chrome&ie=UTF-8 ) (pg. 1) states that
"This apparent expansion of the acute angle occurs
at the angles between 0 and 90 in the Zllner illusion
(Morinaga, 1933; Wallace & Crampin, 1969). On
the other hand, in the tilt illusion, the acute-angle expansion
appears at the angles between 0 and 50, and, to the
contrary, the acute-angle contraction, called the indirect
effect, occurs at the angles between 50 and 90..." '
"
------------------------------------------------------------------------------------------------
I want to bring back roller language for reasons other than forex trading,
so I'll be (, I think,) working on it here. I want to use rl in conjunction with two-fer, in my own ptm, since it fits with at-least-small companies - their news - their stock charts - those charts' technicals. But, I'd have to a) know when a forex pair started, and b) that pair'd have to be unique, even if within a group of similar pairs(/companies). Neither is true, though if I could get a) for each in the pair, I guess I could configure each side of the pair.
So I'm not sure how to test rl even nearby forex; I may bring in some stocks, correlate a bunch of same - base - country pairs at the same news and measure the respective difference between each pair.
Anyway, here's my description of roller language, exactly from the post at my ff thread "EUR/USD patterns". I guess I'll be mushing it up to work with it so I can get it into my own ptm :
"http://www.forexfactory.com/showthread.php?p=2337700#post2337700"
"Here's a simple example of roller language works, including the extended patterns, basic variations of the definition of each rl pattern, and rules and conditions that allow reasoning future actions from the given patterns. The example excludes rl sets, trendlines within rl patterns, and more-complex interpattern reasoning.
*WARNING* This explanation is lengthy and necessitates an almost-continuous viewing of the given chart. Also, experienced viewers, please bear with me, I'm explaining how a cohesive group of patterns works; its use, when appropriate to the chart for whatever symbol or pair, helps in what I view as the ultimate need of a trader's toolbox, that of providing reason enough for the next trade. I'd rather break everything down in a logical, sequential fashion, even explaining the same thing twice occasionally, than just hand a new set of patterns to you with a few words. Beginners who don't want to use my set of patterns will at least get something from the line of reasoning below that using several patterns necessitates.
{insert chart here}
It's simple because every rl pattern is plainly defined in this example (more on this later.) It does include the extended portion of roller language, which is
hash (a bunch of cross-hatched lines, forming parallelograms within)
.. then step to roll..
line, or line segment
point (here, 'pivot')
These patterns, or shapes since they're often simple, are plain, implied and easily cross over the regular patterns in their own way; thus, they're in the extended portion. Regular patterns adjoin each other, or even, on scale, cross over each other; they, however, generally respect the boundaries of the other regular patterns.
A walk-through of this example:
First, you see a step. It's a reasonably pure step, only leaning a little and with a nicely-formed symmetric triangle that's not sinking into the step, and jumps a little afterwards as a symtri would, in an easily-recognized direction. The step's symtri's followthrough fails a little, which creates the setup for the next pattern.
A 'maybe' (and a soon-to-be-recognized-in-the-chart pair of lines (or, a channel), which express the 'maybe' pattern's future dominance between them (that is, the channel contains several 'maybe' patterns,)) pattern answers the last pattern's slight failure.
Next is a roll, or rather a rather fractured roll, compromising itself with looking like a peak. Its being there brings in a rule, which in turn will lead to some valuable interpattern reasoning:
As noted in the prior message, the rl patterns are in a particular order. Imagine the center of the basic patterns to be the castle, or 'stability'. Then, put in your mind the 'maybe' pattern on the left side and the peak pattern on the right side. Finally, put the step pattern to the left of the 'maybe' and the roll to the right of the peak.
The rule being noted is that a chart order of a 'maybe' pattern and then a peak pattern is a regular jump from one side of 'stability' to the other; it creates no tension, or at least any tension it creates would only arrive from its being perfectly aligned. One could call this chart order as being in a '0' condition.
A '-1' condition would be a jump from one pattern to a neighbor of its opposing pattern, creating an instability to the natural set (that is, the defining order of roller language's patterns.)
Beside the rule, there are conditions when the 'maybe' goes to the roll. Contraction occurs, in the rl sense. The roll also has features of a peak (condition one), which helps reduce the tension between the 'maybe' and the roll, and thus the side channel forms. The contraction answers the expansion (condition two) that the step did in its jump and failure of the jump.
The modified-'-1' condition of the peakish roll is answered with another 'maybe' pattern, which creates a condition of two examples of the same pattern framing a certain area. This frame-like condition somewhat settles the channel's being there. The size of this second 'maybe', however, is a bit small; the next pattern, a small and very connected step, supports the 'maybe' and its making a frame: The step is on the same side of 'stability' as the 'maybe', it relieves the '-1' condition of the 'maybe' after the 'maybe' challenged the roll, and it matches the first 'maybe' pattern's predecessor, also a step.
A step is an excitor, since it climbs easily. (Note I counted step series. (I was hoping for 3 to 5 steps to be on one ascending trendline; usually, such a series will go sideways after the third or fifth step.)) The frame resolved the side channel's tension, and the regular, if small, step, especially since supported with being related symmetrically with the prior, somewhat bullish step, joins the frame in creating a probable upward motion.
Another step appears, weighed down with the side channel and how releasing of tension the frame was. Then another step appears, a small, stumpy one that almost sits atop the side channel, thus reinforcing it. This creates a 'maybe' condition and pattern that crosses into the last (and third) step, deciding another side channel into probability.
After this 'maybe' pattern is another peakish roll, completing this side channel sitting atop the main side channel. A decent-sized step leaves the side channel; only, it fails miserably, because a pivot, or point (or dot) has appeared. I say 'appeared', only it's a pattern in the extended portion of the rl series, just to the right (in the mind's eye) of the line. There does also exist a condition, at least in this chart, of a big channel then small channel then point series, which is simple and thus may reflect the chart's use of the natural set (which is the defining order of the rl patterns, as listed in the last post and at the top of this post.)
This completes one direction of the chart's general trend. The next direction is down. The step, having just barely reached above the smaller side channel, breaks down from a pivot and falls into the original, bigger side channel's upper half. This step is upside-down and very fast, with a bit of an inward-into-the-bigger-channel's-wall angle to its symmetric triangle. Then another step happens, this one short, stumpy and with a relatively-large symmetric triangle to stay inside the side channel it's in.
This last step, with its short stem and big symmetric triangle, hits the channel's base strongly, and the big symmetric triangle, with the channel's base, acts as a kind of support to reverse the usual direction of a step's symmetric triangle's reaction. It ends the down direction. Another step appears and creates the next, up direction. (I decided not to count steps this time, since direction changed.) This step immediately hits the big side channel's upper wall, leaning while it does so. However, this step is also thin, in contrast to the last step, and that contrast is a condition that relieves the tension (in the price-time line of the general chart), on top of the grounding effect the turn related to the last, heavy step had.
Another, even lighter step breaks from the relatively-light last step and through the big side channel's upper wall. This lighter step has some issues, such as one of its price-time line's candles having a long shadow into the lower big channel before it leaves it. This condition creates a lagging weight on the p-tl line, a condition internal to the rl pattern, and suggests that beyond this chart lies more internally-weighted rl patterns and thus a more-slanting trend. The final portion of the chart shown reflects this condition, looking like a slanted reaction to the step's symmetric triangle, a reaction that, in the chart's last candle, retreated.
The reactions shown with the last pattern could develop into a choice of several patterns, which will have, probably, the noted internal condition, a tension of reacting to the smaller channel's upper wall. This modifies the bullish condition of there having been two of the usual 3-5 steps in one direction already. Also, the big side channel - small side channel - point series provides a condition more in the background for the p-t line beyond this chart to react to.
Oh yes, the 'hash':
The 'hash' appeared as a counter to the point and line (series) on, in the mind's eye, the other side of 'stability' (castle, in the natural set.) Notice how the chart's last two patterns, excluding the last pattern's reaction, creates a straightened 'N'. This straightened 'N' reflects the levels the price-time line already ran through. The 'hash' is somewhat invisible, being on the extended portion of the natural set, that is, of the order defining roller language. (There is only eight pattterns, not nine, in rl; the core portion is symmetric, and the extended portion is conceptually, not literally, symmetric coinciding with the core portion between either side of the extended portion ('hash' on the left and line then point on the right, in the mind's eye.) The 'hash' also created the condition of satisfying the chart's area including the shown chart's first pattern, the relatively-pure step and its reaction, and excluding the chart's last pattern, the internally-corrupt step and its reaction.
I've described how all of the patterns shown on the given chart connect to each other. Yes, of course, there are lots of other methods of describing it, even of describing the patterns I named. Roller language is one more way to describe a chart, and one advantage is that it is all-in-one.
I arrived at this grouping of patterns when I was trading stocks. Stocks each tend to create a set or pair of rl patterns particular to that stock, in the less-flexible (not usually containing the ability to center and create 0/-1 conditions of tension from this centering, that the natural set has) derivation of the 'natural set'. Forex pairs do contain rl patterns; speaking for the EUR/USD, which I've demo'ed for several months, I found runthroughs of the natural set, some inter-rl-pattern tension and same-rl-pattern framing, and miscellaneous other use of roller language. Pairs, unlike single symbols, don't seem to have an rl set or pair individual to each, at least not from what I've observed to now.
Rl sets and pairs, except the natural set's, create an 'unnatural' condition to deriving from the natural set and going their own individualistic path: Chart interpretation becomes based on this 'unnatural' set, and thus the interpretation of the given chart in this post only serves as a basic understanding to roller language. Inter-pattern reasoning turns more complex, and one has to, at least with stocks, strive to find stocks that are easier to interpret.
Also, this example excludes castles. This is a good thing, because stating obviously one's stability in turn exposes it to other patterns using and even warping its stability and further use of the natural set within that symbol's chart. Finally, this example does not describe conflicting interests, such as a chart area repeating without ever really looking like roller language within its confines, or at least, through lots of repeating, copying, flipping and other warpings of that one chart area, negating the benefit of using rl with and within the chart area. You could call such an area as containing an undivided pattern of 'energy', as a proxy to calling it some made-up name; that is, you could call a chart area with such properties an energy set or pattern.
Forex, now that I think of it, plays with the notion of roller language, it's so experienced (lots of users/traders creating it with lots of capital; in stocks, the company a stock represents is trying to sell a complex idea, thus its individualistic rl set (less so, if a pair) is more complex and thus more likely to be more an energy set than a set with differentiated (rl) patterns) and it uses more than one symbol in its chart (being a pair.) These two conditions allow lots of energy sets and thus the availability of new patterns being named, such as the 'bird of prey' (or flight o' bird) pattern, to deal with them; and, in forex, at least up to now that I've seen, no derivation of the natural set exists, so roller language in forex has a lot to do with the above given chart and its explanation, if only between these sometimes-named energy sets and thus broken into areas more serving these energy sets than playing off each other in a string of rl patterns as in the given chart.
That's all there is to roller language. Rl creates a new paradigm for understanding charts."
If I can figure a reasonable answer for you, I'll give it a try.
--------------------------------------------------------------------------------
Separate from and ignorant of the post above,
I wrote another new (practice) trading method.
This time,
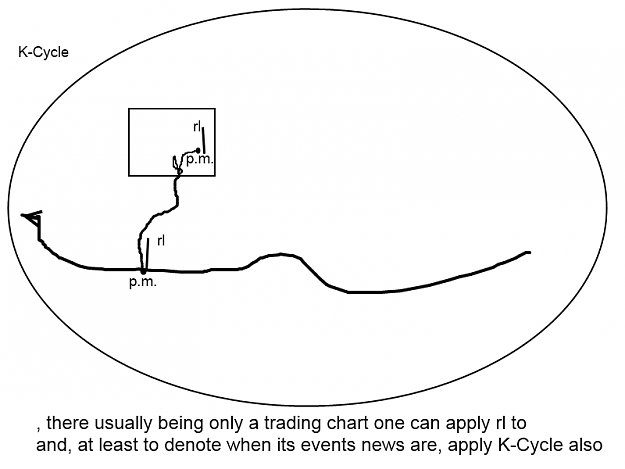
most of it is written on the pictures of charts below:
Attached Image (click to enlarge)
Attached Image (click to enlarge)
Attached Image (click to enlarge)
Attached Image (click to enlarge)
Attached Image (click to enlarge)
A line segment is vertical, and its severe with-the-money attribute is the first thing I draw.
Then, any all-radiuses i.e. circles/curves,
Areas two-fer -- thus, the name of the method -- opposites,
so that area can be both ruled out and squares to at least surround that area and, third, projecting patterns may or may not align with such a big number of candles.
Then, triangles may be drawn off opposite-situating points, and so on, for the details to consider.
-- The method is simple, but it's well-organized -- I assume, and I've only practiced it in the pictures above -- and thus effective (I think, as of now).
-----------------------------------
last method:
"
In this method, I simplify the technicals -- although the option to complicate them is, still open.
I use a grid -- vertical and horizontal lines, where applicable -- , an anti-grid -- any 45D - or - so (50D, too, I'd guess) -- (a great place for long-term - lines ('complicat'ions)), and a grid-maker -- curves, as represented in MT4 by circles (or, rather, ellipses).
Then, the 50D illusion, which may or may not decide direction, stays:
The 'A rule from here ( https://www.google.com/search?q=Three+elemental+illusions+ determine+the+Z%C3%B6llner+illusion &oq=Three+elemental+illusions+deter mine+the+Z%C3%B6llner+illusion&aqs= chrome..69i57.352523430j0j0&sourcei d=chrome&ie=UTF-8 ) (pg. 1) states that
"This apparent expansion of the acute angle occurs
at the angles between 0 and 90 in the Zllner illusion
(Morinaga, 1933; Wallace & Crampin, 1969). On
the other hand, in the tilt illusion, the acute-angle expansion
appears at the angles between 0 and 50, and, to the
contrary, the acute-angle contraction, called the indirect
effect, occurs at the angles between 50 and 90..." '
"
------------------------------------------------------------------------------------------------
I want to bring back roller language for reasons other than forex trading,
so I'll be (, I think,) working on it here. I want to use rl in conjunction with two-fer, in my own ptm, since it fits with at-least-small companies - their news - their stock charts - those charts' technicals. But, I'd have to a) know when a forex pair started, and b) that pair'd have to be unique, even if within a group of similar pairs(/companies). Neither is true, though if I could get a) for each in the pair, I guess I could configure each side of the pair.
So I'm not sure how to test rl even nearby forex; I may bring in some stocks, correlate a bunch of same - base - country pairs at the same news and measure the respective difference between each pair.
Anyway, here's my description of roller language, exactly from the post at my ff thread "EUR/USD patterns". I guess I'll be mushing it up to work with it so I can get it into my own ptm :
"http://www.forexfactory.com/showthread.php?p=2337700#post2337700"
"Here's a simple example of roller language works, including the extended patterns, basic variations of the definition of each rl pattern, and rules and conditions that allow reasoning future actions from the given patterns. The example excludes rl sets, trendlines within rl patterns, and more-complex interpattern reasoning.
*WARNING* This explanation is lengthy and necessitates an almost-continuous viewing of the given chart. Also, experienced viewers, please bear with me, I'm explaining how a cohesive group of patterns works; its use, when appropriate to the chart for whatever symbol or pair, helps in what I view as the ultimate need of a trader's toolbox, that of providing reason enough for the next trade. I'd rather break everything down in a logical, sequential fashion, even explaining the same thing twice occasionally, than just hand a new set of patterns to you with a few words. Beginners who don't want to use my set of patterns will at least get something from the line of reasoning below that using several patterns necessitates.
{insert chart here}
It's simple because every rl pattern is plainly defined in this example (more on this later.) It does include the extended portion of roller language, which is
hash (a bunch of cross-hatched lines, forming parallelograms within)
.. then step to roll..
line, or line segment
point (here, 'pivot')
These patterns, or shapes since they're often simple, are plain, implied and easily cross over the regular patterns in their own way; thus, they're in the extended portion. Regular patterns adjoin each other, or even, on scale, cross over each other; they, however, generally respect the boundaries of the other regular patterns.
A walk-through of this example:
First, you see a step. It's a reasonably pure step, only leaning a little and with a nicely-formed symmetric triangle that's not sinking into the step, and jumps a little afterwards as a symtri would, in an easily-recognized direction. The step's symtri's followthrough fails a little, which creates the setup for the next pattern.
A 'maybe' (and a soon-to-be-recognized-in-the-chart pair of lines (or, a channel), which express the 'maybe' pattern's future dominance between them (that is, the channel contains several 'maybe' patterns,)) pattern answers the last pattern's slight failure.
Next is a roll, or rather a rather fractured roll, compromising itself with looking like a peak. Its being there brings in a rule, which in turn will lead to some valuable interpattern reasoning:
As noted in the prior message, the rl patterns are in a particular order. Imagine the center of the basic patterns to be the castle, or 'stability'. Then, put in your mind the 'maybe' pattern on the left side and the peak pattern on the right side. Finally, put the step pattern to the left of the 'maybe' and the roll to the right of the peak.
The rule being noted is that a chart order of a 'maybe' pattern and then a peak pattern is a regular jump from one side of 'stability' to the other; it creates no tension, or at least any tension it creates would only arrive from its being perfectly aligned. One could call this chart order as being in a '0' condition.
A '-1' condition would be a jump from one pattern to a neighbor of its opposing pattern, creating an instability to the natural set (that is, the defining order of roller language's patterns.)
Beside the rule, there are conditions when the 'maybe' goes to the roll. Contraction occurs, in the rl sense. The roll also has features of a peak (condition one), which helps reduce the tension between the 'maybe' and the roll, and thus the side channel forms. The contraction answers the expansion (condition two) that the step did in its jump and failure of the jump.
The modified-'-1' condition of the peakish roll is answered with another 'maybe' pattern, which creates a condition of two examples of the same pattern framing a certain area. This frame-like condition somewhat settles the channel's being there. The size of this second 'maybe', however, is a bit small; the next pattern, a small and very connected step, supports the 'maybe' and its making a frame: The step is on the same side of 'stability' as the 'maybe', it relieves the '-1' condition of the 'maybe' after the 'maybe' challenged the roll, and it matches the first 'maybe' pattern's predecessor, also a step.
A step is an excitor, since it climbs easily. (Note I counted step series. (I was hoping for 3 to 5 steps to be on one ascending trendline; usually, such a series will go sideways after the third or fifth step.)) The frame resolved the side channel's tension, and the regular, if small, step, especially since supported with being related symmetrically with the prior, somewhat bullish step, joins the frame in creating a probable upward motion.
Another step appears, weighed down with the side channel and how releasing of tension the frame was. Then another step appears, a small, stumpy one that almost sits atop the side channel, thus reinforcing it. This creates a 'maybe' condition and pattern that crosses into the last (and third) step, deciding another side channel into probability.
After this 'maybe' pattern is another peakish roll, completing this side channel sitting atop the main side channel. A decent-sized step leaves the side channel; only, it fails miserably, because a pivot, or point (or dot) has appeared. I say 'appeared', only it's a pattern in the extended portion of the rl series, just to the right (in the mind's eye) of the line. There does also exist a condition, at least in this chart, of a big channel then small channel then point series, which is simple and thus may reflect the chart's use of the natural set (which is the defining order of the rl patterns, as listed in the last post and at the top of this post.)
This completes one direction of the chart's general trend. The next direction is down. The step, having just barely reached above the smaller side channel, breaks down from a pivot and falls into the original, bigger side channel's upper half. This step is upside-down and very fast, with a bit of an inward-into-the-bigger-channel's-wall angle to its symmetric triangle. Then another step happens, this one short, stumpy and with a relatively-large symmetric triangle to stay inside the side channel it's in.
This last step, with its short stem and big symmetric triangle, hits the channel's base strongly, and the big symmetric triangle, with the channel's base, acts as a kind of support to reverse the usual direction of a step's symmetric triangle's reaction. It ends the down direction. Another step appears and creates the next, up direction. (I decided not to count steps this time, since direction changed.) This step immediately hits the big side channel's upper wall, leaning while it does so. However, this step is also thin, in contrast to the last step, and that contrast is a condition that relieves the tension (in the price-time line of the general chart), on top of the grounding effect the turn related to the last, heavy step had.
Another, even lighter step breaks from the relatively-light last step and through the big side channel's upper wall. This lighter step has some issues, such as one of its price-time line's candles having a long shadow into the lower big channel before it leaves it. This condition creates a lagging weight on the p-tl line, a condition internal to the rl pattern, and suggests that beyond this chart lies more internally-weighted rl patterns and thus a more-slanting trend. The final portion of the chart shown reflects this condition, looking like a slanted reaction to the step's symmetric triangle, a reaction that, in the chart's last candle, retreated.
The reactions shown with the last pattern could develop into a choice of several patterns, which will have, probably, the noted internal condition, a tension of reacting to the smaller channel's upper wall. This modifies the bullish condition of there having been two of the usual 3-5 steps in one direction already. Also, the big side channel - small side channel - point series provides a condition more in the background for the p-t line beyond this chart to react to.
Oh yes, the 'hash':
The 'hash' appeared as a counter to the point and line (series) on, in the mind's eye, the other side of 'stability' (castle, in the natural set.) Notice how the chart's last two patterns, excluding the last pattern's reaction, creates a straightened 'N'. This straightened 'N' reflects the levels the price-time line already ran through. The 'hash' is somewhat invisible, being on the extended portion of the natural set, that is, of the order defining roller language. (There is only eight pattterns, not nine, in rl; the core portion is symmetric, and the extended portion is conceptually, not literally, symmetric coinciding with the core portion between either side of the extended portion ('hash' on the left and line then point on the right, in the mind's eye.) The 'hash' also created the condition of satisfying the chart's area including the shown chart's first pattern, the relatively-pure step and its reaction, and excluding the chart's last pattern, the internally-corrupt step and its reaction.
I've described how all of the patterns shown on the given chart connect to each other. Yes, of course, there are lots of other methods of describing it, even of describing the patterns I named. Roller language is one more way to describe a chart, and one advantage is that it is all-in-one.
I arrived at this grouping of patterns when I was trading stocks. Stocks each tend to create a set or pair of rl patterns particular to that stock, in the less-flexible (not usually containing the ability to center and create 0/-1 conditions of tension from this centering, that the natural set has) derivation of the 'natural set'. Forex pairs do contain rl patterns; speaking for the EUR/USD, which I've demo'ed for several months, I found runthroughs of the natural set, some inter-rl-pattern tension and same-rl-pattern framing, and miscellaneous other use of roller language. Pairs, unlike single symbols, don't seem to have an rl set or pair individual to each, at least not from what I've observed to now.
Rl sets and pairs, except the natural set's, create an 'unnatural' condition to deriving from the natural set and going their own individualistic path: Chart interpretation becomes based on this 'unnatural' set, and thus the interpretation of the given chart in this post only serves as a basic understanding to roller language. Inter-pattern reasoning turns more complex, and one has to, at least with stocks, strive to find stocks that are easier to interpret.
Also, this example excludes castles. This is a good thing, because stating obviously one's stability in turn exposes it to other patterns using and even warping its stability and further use of the natural set within that symbol's chart. Finally, this example does not describe conflicting interests, such as a chart area repeating without ever really looking like roller language within its confines, or at least, through lots of repeating, copying, flipping and other warpings of that one chart area, negating the benefit of using rl with and within the chart area. You could call such an area as containing an undivided pattern of 'energy', as a proxy to calling it some made-up name; that is, you could call a chart area with such properties an energy set or pattern.
Forex, now that I think of it, plays with the notion of roller language, it's so experienced (lots of users/traders creating it with lots of capital; in stocks, the company a stock represents is trying to sell a complex idea, thus its individualistic rl set (less so, if a pair) is more complex and thus more likely to be more an energy set than a set with differentiated (rl) patterns) and it uses more than one symbol in its chart (being a pair.) These two conditions allow lots of energy sets and thus the availability of new patterns being named, such as the 'bird of prey' (or flight o' bird) pattern, to deal with them; and, in forex, at least up to now that I've seen, no derivation of the natural set exists, so roller language in forex has a lot to do with the above given chart and its explanation, if only between these sometimes-named energy sets and thus broken into areas more serving these energy sets than playing off each other in a string of rl patterns as in the given chart.
That's all there is to roller language. Rl creates a new paradigm for understanding charts."