Mec is okay for handling emotions, but not for reading chart patterns.
rl seems better to do, so that -- since rl is designed to read news into the chart, and when few symbols (such as with forex (vs. companies')) exist, it's perhaps easier to use rl and then throw in typical trading chart devices where rl shows a good place to use one.
Example:
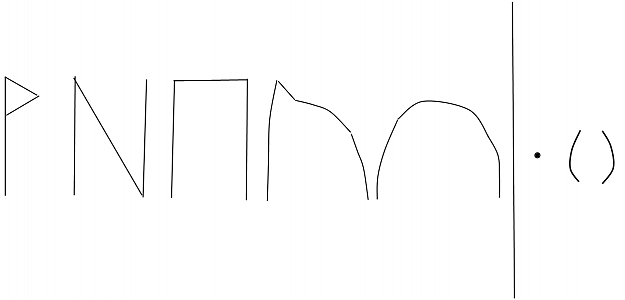
Here, I wrote down the five rl patterns that I use, plus, to right of the vertical line, make-of shapes I rather think of than directly use.

For non-used-with-news, I can just put in the rl patterns to catch a quick in-rl-pattern run. More likely -- as noted above -- , though, the chart's symbol has either a) very heavy trading use and few other symbols to compete with for news, such as forex, or b) extraordinary effect on the life of that chart's symbol by news, as in a smaller and/or heavy seasonal-profit/loss cycles for the company (and thus (sub)industry of that company). To note of the latter, original story of that chart's symbol's company sets the pattern that one compares to later on and becomes a fixed repetition, and/or, depending on the company's size and/or treatment by its investors over time, from a mere single rl pattern -- the order of the rl patterns reveals both the names of them, which is 'flag' (the traditional pattern), 'maybe', stable', 'spike', and 'roll' (also a regular, but here simplified, pattern). For example, I've found 'stable' sitting alone supportively amidst big drug companies, other rl patterns' support for 'flag' around news for a small company making, as I recall, cellphone towers (in 2004, the year I made the chart-reading method ).
This approach became quite interesting, seeing how investors literally treated the company they supported's stories'/y's chart(s). However, my trading capability that one needs separate from interpreting the chart itself was (and, to my knowledge, still is) poor, and I searched for other ways of dealing with the chart. My thought overall in terms of the chart was that if I can't make it with rl patterns in forex, then I can't make it at all, since, as I reasoned, the chart in forex is about money itself, and runs -- theoretically, at least -- 24 hours a day every day, even if many of the world's most-important countries don't participate their types of money in this market.
So I lasted a short time, actual money-wise, in the forex market -- its money handlers being often much more ruthless, and/or its market being very different than the small / in-trouble companies I was used to trading (although, I now recall, the in-trouble ones I went out of my-money trading on, did also have a whole-industry single rl pattern it depended on, too, as does bigger companies and forex symbols -- since apparently, shoving the traditional chart-pattern devices into that chart more often, as per this post's charts shown for an old time in GB/US forex symbol, would've done more good at that time.)
The many types of patterns I've made in my 'GB/US' posts thread before and after the rl-patterns post, they served to further break down for me the idea of what a chart really is, which helped me understand other things in my life (such as mec, and so on even more personally), and I discussed it at this site, in the current post thread. Then I'd return to the aforementioned habit of interpreting practice charts with a new set of chart patterns that the most-considered charts forex money markets' charts are, may work into a good trade for me with.
That brings me to now, a time when I exhausted, for my non-trading applications of time-drawing patterns at least, innovative new chart patterns, and instead, I began recently to focus on summarizing ANY 2(,3)D pattern and its common existence along time (from, so to speak, space). I came up with, this week, a dot -- 'position', as those in math often describe it --, a closed-boundary shape -- 'contain', I may call it, to match its style of naming with dot's --, and, finally, a line of any curvature that is not a closed boundary -- 'direct', in turn for the aforementioned reason.
I haven't found a use of these three shapes, as they are not so much shapes, as organization of all shapes, because the thinking model I created tends to reflect upon space more than time, and thus is the opposite -- and all, since I've included the idea, if not so much, the actuality, of trading charts in making my thinking model -- of the time-dependent nature trading charts are. This is since a trading chart can snap back often, but in space-dependent real life (I've found and/or read/observed about) that objects/animals/etc. experience, one cannot have any chance to snap back from in any case, far more-so than with small companies and their charts.
So maybe I should reflect on how this newer-to-me set of patterns works in forex trading parts. They may have something to do with the traditional chart patterns built into the chart program -- what I meant was, those large-space-coverting ones, such as Gann fan or a big grid making right-angles frames or an echo of aligned curves or, well, etc. (of which I also have a somewhat-reasonable amount of experience (in practice) with), each anchored point or two along time. The chart makes space out of time, so I'm uncomfortable with that notion by simply sticking a filled shape (rectangle,triangle, circle) without further deliberation-about, which are more involved with dividing up space, though I now guess that one could consider a bunch of smaller shapes within such filled shapes as having their own respective life cycle and thus, with respect to the filled shape they're in, having time being first in their stay inside that space that the filled shape contains.
Somewhere along the range of possibilities that this last idea suggests, could exist in a space-prevalent model, but, I think, not in -- as a trading chart is -- a time-prevalent model. So, I must think further with the same and/or similar set of variables this idea has.
Hmmm....
One caveat, which came to me while rewriting post #1 of this thread just now, and that may help to continue this now-opened discussion, is this:
Early on, I did have experience both money-invested and, much more time-wise extensively, practiced, with many forex symbols. I did notice each forex symbol does have its own chart-pattern peculiarities, because its most-(,)money percentage of traders is, in each instance, a different set of traders.
Also, I did experiment with reading news with forex, but neglected to do so -- although, I now recall, came up with some very intensively-influential comparisons between different forex symbols for the impact one currency's news has on other currencies, I also ran into technology problems of keeping up with the market in such a heavy-technology-dependent approach, so I stopped using news in forex, perhaps also due to the influence of me trading for real and before me practice-trading forex charts, the much-heavier impact that the small companies' news had on their charts.
rl seems better to do, so that -- since rl is designed to read news into the chart, and when few symbols (such as with forex (vs. companies')) exist, it's perhaps easier to use rl and then throw in typical trading chart devices where rl shows a good place to use one.
Example:
Attached Image (click to enlarge)
Attached Image (click to enlarge)
Attached Image (click to enlarge)
Here, I wrote down the five rl patterns that I use, plus, to right of the vertical line, make-of shapes I rather think of than directly use.
Attached Image (click to enlarge)
For non-used-with-news, I can just put in the rl patterns to catch a quick in-rl-pattern run. More likely -- as noted above -- , though, the chart's symbol has either a) very heavy trading use and few other symbols to compete with for news, such as forex, or b) extraordinary effect on the life of that chart's symbol by news, as in a smaller and/or heavy seasonal-profit/loss cycles for the company (and thus (sub)industry of that company). To note of the latter, original story of that chart's symbol's company sets the pattern that one compares to later on and becomes a fixed repetition, and/or, depending on the company's size and/or treatment by its investors over time, from a mere single rl pattern -- the order of the rl patterns reveals both the names of them, which is 'flag' (the traditional pattern), 'maybe', stable', 'spike', and 'roll' (also a regular, but here simplified, pattern). For example, I've found 'stable' sitting alone supportively amidst big drug companies, other rl patterns' support for 'flag' around news for a small company making, as I recall, cellphone towers (in 2004, the year I made the chart-reading method ).
This approach became quite interesting, seeing how investors literally treated the company they supported's stories'/y's chart(s). However, my trading capability that one needs separate from interpreting the chart itself was (and, to my knowledge, still is) poor, and I searched for other ways of dealing with the chart. My thought overall in terms of the chart was that if I can't make it with rl patterns in forex, then I can't make it at all, since, as I reasoned, the chart in forex is about money itself, and runs -- theoretically, at least -- 24 hours a day every day, even if many of the world's most-important countries don't participate their types of money in this market.
So I lasted a short time, actual money-wise, in the forex market -- its money handlers being often much more ruthless, and/or its market being very different than the small / in-trouble companies I was used to trading (although, I now recall, the in-trouble ones I went out of my-money trading on, did also have a whole-industry single rl pattern it depended on, too, as does bigger companies and forex symbols -- since apparently, shoving the traditional chart-pattern devices into that chart more often, as per this post's charts shown for an old time in GB/US forex symbol, would've done more good at that time.)
The many types of patterns I've made in my 'GB/US' posts thread before and after the rl-patterns post, they served to further break down for me the idea of what a chart really is, which helped me understand other things in my life (such as mec, and so on even more personally), and I discussed it at this site, in the current post thread. Then I'd return to the aforementioned habit of interpreting practice charts with a new set of chart patterns that the most-considered charts forex money markets' charts are, may work into a good trade for me with.
That brings me to now, a time when I exhausted, for my non-trading applications of time-drawing patterns at least, innovative new chart patterns, and instead, I began recently to focus on summarizing ANY 2(,3)D pattern and its common existence along time (from, so to speak, space). I came up with, this week, a dot -- 'position', as those in math often describe it --, a closed-boundary shape -- 'contain', I may call it, to match its style of naming with dot's --, and, finally, a line of any curvature that is not a closed boundary -- 'direct', in turn for the aforementioned reason.
I haven't found a use of these three shapes, as they are not so much shapes, as organization of all shapes, because the thinking model I created tends to reflect upon space more than time, and thus is the opposite -- and all, since I've included the idea, if not so much, the actuality, of trading charts in making my thinking model -- of the time-dependent nature trading charts are. This is since a trading chart can snap back often, but in space-dependent real life (I've found and/or read/observed about) that objects/animals/etc. experience, one cannot have any chance to snap back from in any case, far more-so than with small companies and their charts.
So maybe I should reflect on how this newer-to-me set of patterns works in forex trading parts. They may have something to do with the traditional chart patterns built into the chart program -- what I meant was, those large-space-coverting ones, such as Gann fan or a big grid making right-angles frames or an echo of aligned curves or, well, etc. (of which I also have a somewhat-reasonable amount of experience (in practice) with), each anchored point or two along time. The chart makes space out of time, so I'm uncomfortable with that notion by simply sticking a filled shape (rectangle,triangle, circle) without further deliberation-about, which are more involved with dividing up space, though I now guess that one could consider a bunch of smaller shapes within such filled shapes as having their own respective life cycle and thus, with respect to the filled shape they're in, having time being first in their stay inside that space that the filled shape contains.
Somewhere along the range of possibilities that this last idea suggests, could exist in a space-prevalent model, but, I think, not in -- as a trading chart is -- a time-prevalent model. So, I must think further with the same and/or similar set of variables this idea has.
Hmmm....
One caveat, which came to me while rewriting post #1 of this thread just now, and that may help to continue this now-opened discussion, is this:
Early on, I did have experience both money-invested and, much more time-wise extensively, practiced, with many forex symbols. I did notice each forex symbol does have its own chart-pattern peculiarities, because its most-(,)money percentage of traders is, in each instance, a different set of traders.
Also, I did experiment with reading news with forex, but neglected to do so -- although, I now recall, came up with some very intensively-influential comparisons between different forex symbols for the impact one currency's news has on other currencies, I also ran into technology problems of keeping up with the market in such a heavy-technology-dependent approach, so I stopped using news in forex, perhaps also due to the influence of me trading for real and before me practice-trading forex charts, the much-heavier impact that the small companies' news had on their charts.